Subsaharan African vs Korean 12th Grade, No Diploma
COMPARE
Subsaharan African
Korean
12th Grade, No Diploma
12th Grade, No Diploma Comparison
Sub-Saharan Africans
Koreans
90.1%
12TH GRADE, NO DIPLOMA
1.9/ 100
METRIC RATING
239th/ 347
METRIC RANK
90.8%
12TH GRADE, NO DIPLOMA
24.5/ 100
METRIC RATING
195th/ 347
METRIC RANK
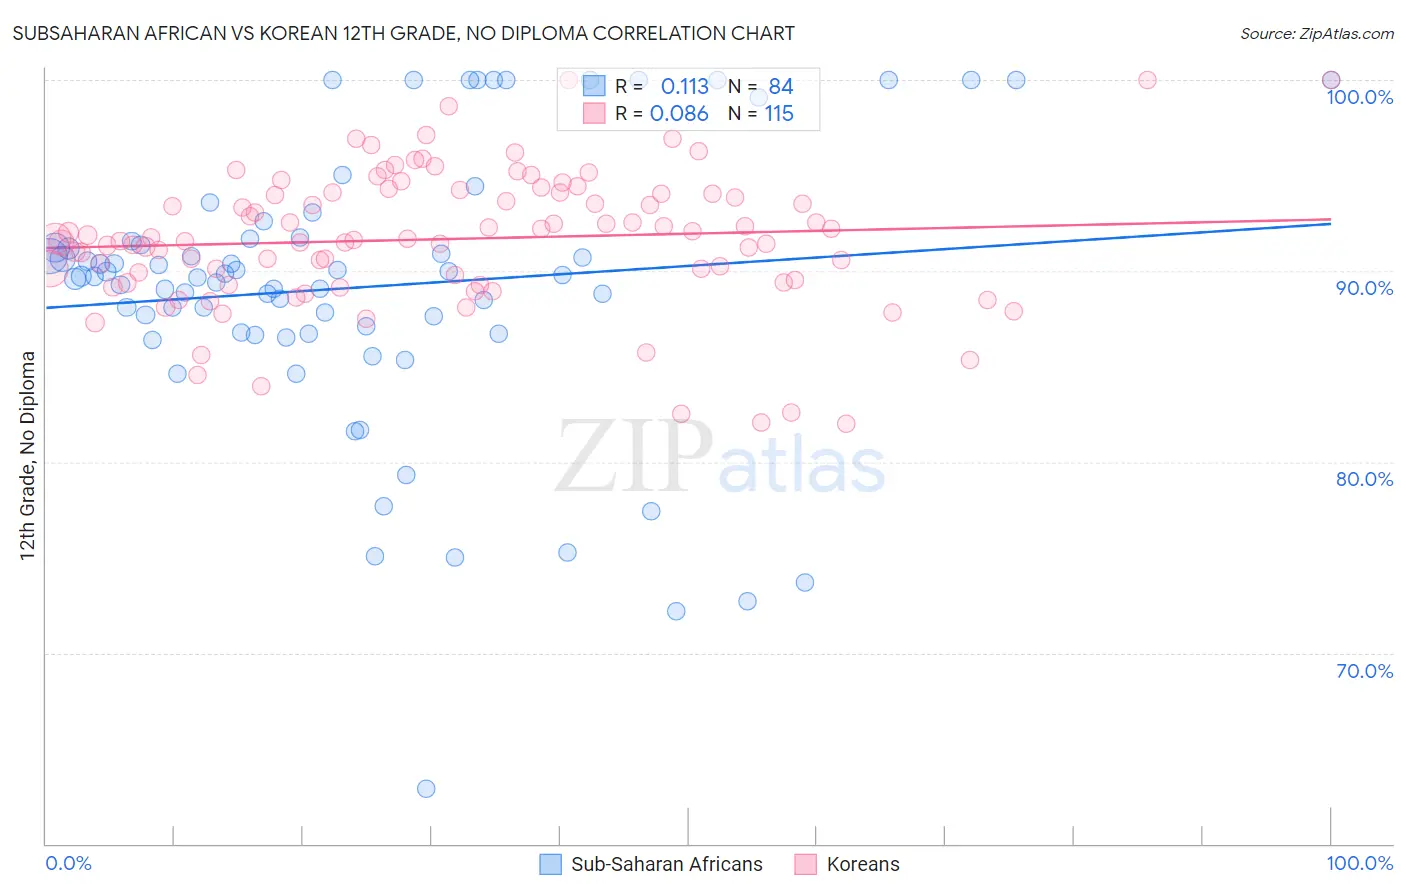
Subsaharan African vs Korean 12th Grade, No Diploma Correlation Chart
The statistical analysis conducted on geographies consisting of 508,219,008 people shows a poor positive correlation between the proportion of Sub-Saharan Africans and percentage of population with at least 12th grade (no diploma) education in the United States with a correlation coefficient (R) of 0.113 and weighted average of 90.1%. Similarly, the statistical analysis conducted on geographies consisting of 510,943,943 people shows a slight positive correlation between the proportion of Koreans and percentage of population with at least 12th grade (no diploma) education in the United States with a correlation coefficient (R) of 0.086 and weighted average of 90.8%, a difference of 0.88%.
12th Grade, No Diploma Correlation Summary
| Measurement | Subsaharan African | Korean |
| Minimum | 62.8% | 82.0% |
| Maximum | 100.0% | 100.0% |
| Range | 37.2% | 18.0% |
| Mean | 89.2% | 91.7% |
| Median | 89.7% | 91.7% |
| Interquartile 25% (IQ1) | 86.7% | 89.4% |
| Interquartile 75% (IQ3) | 91.6% | 94.1% |
| Interquartile Range (IQR) | 4.9% | 4.7% |
| Standard Deviation (Sample) | 7.3% | 3.6% |
| Standard Deviation (Population) | 7.3% | 3.6% |
Similar Demographics by 12th Grade, No Diploma
Demographics Similar to Sub-Saharan Africans by 12th Grade, No Diploma
In terms of 12th grade, no diploma, the demographic groups most similar to Sub-Saharan Africans are Inupiat (90.1%, a difference of 0.020%), Kiowa (90.0%, a difference of 0.020%), Immigrants from Colombia (90.1%, a difference of 0.030%), Immigrants from Middle Africa (90.0%, a difference of 0.030%), and Immigrants from Uzbekistan (90.1%, a difference of 0.050%).
| Demographics | Rating | Rank | 12th Grade, No Diploma |
| Blackfeet | 2.4 /100 | #232 | Tragic 90.1% |
| Immigrants | Thailand | 2.3 /100 | #233 | Tragic 90.1% |
| Immigrants | South America | 2.3 /100 | #234 | Tragic 90.1% |
| Colville | 2.3 /100 | #235 | Tragic 90.1% |
| Immigrants | Uzbekistan | 2.2 /100 | #236 | Tragic 90.1% |
| Immigrants | Colombia | 2.1 /100 | #237 | Tragic 90.1% |
| Inupiat | 2.0 /100 | #238 | Tragic 90.1% |
| Sub-Saharan Africans | 1.9 /100 | #239 | Tragic 90.1% |
| Kiowa | 1.7 /100 | #240 | Tragic 90.0% |
| Immigrants | Middle Africa | 1.7 /100 | #241 | Tragic 90.0% |
| Immigrants | Costa Rica | 1.6 /100 | #242 | Tragic 90.0% |
| Crow | 1.5 /100 | #243 | Tragic 90.0% |
| Taiwanese | 1.5 /100 | #244 | Tragic 90.0% |
| Immigrants | Uruguay | 1.4 /100 | #245 | Tragic 90.0% |
| Ghanaians | 1.3 /100 | #246 | Tragic 90.0% |
Demographics Similar to Koreans by 12th Grade, No Diploma
In terms of 12th grade, no diploma, the demographic groups most similar to Koreans are Immigrants from Oceania (90.9%, a difference of 0.030%), Panamanian (90.8%, a difference of 0.030%), Immigrants from Sudan (90.8%, a difference of 0.030%), Immigrants from Ethiopia (90.9%, a difference of 0.040%), and Immigrants from Eastern Africa (90.9%, a difference of 0.050%).
| Demographics | Rating | Rank | 12th Grade, No Diploma |
| Americans | 32.6 /100 | #188 | Fair 91.0% |
| Immigrants | Uganda | 31.6 /100 | #189 | Fair 90.9% |
| Afghans | 29.9 /100 | #190 | Fair 90.9% |
| Moroccans | 28.8 /100 | #191 | Fair 90.9% |
| Immigrants | Eastern Africa | 27.7 /100 | #192 | Fair 90.9% |
| Immigrants | Ethiopia | 27.2 /100 | #193 | Fair 90.9% |
| Immigrants | Oceania | 26.0 /100 | #194 | Fair 90.9% |
| Koreans | 24.5 /100 | #195 | Fair 90.8% |
| Panamanians | 22.8 /100 | #196 | Fair 90.8% |
| Immigrants | Sudan | 22.6 /100 | #197 | Fair 90.8% |
| Samoans | 20.4 /100 | #198 | Fair 90.8% |
| Immigrants | Southern Europe | 19.9 /100 | #199 | Poor 90.8% |
| Liberians | 19.8 /100 | #200 | Poor 90.8% |
| Hawaiians | 19.7 /100 | #201 | Poor 90.8% |
| Marshallese | 18.2 /100 | #202 | Poor 90.7% |