Subsaharan African vs Immigrants from El Salvador Doctorate Degree
COMPARE
Subsaharan African
Immigrants from El Salvador
Doctorate Degree
Doctorate Degree Comparison
Sub-Saharan Africans
Immigrants from El Salvador
1.8%
DOCTORATE DEGREE
25.1/ 100
METRIC RATING
196th/ 347
METRIC RANK
1.4%
DOCTORATE DEGREE
0.3/ 100
METRIC RATING
288th/ 347
METRIC RANK
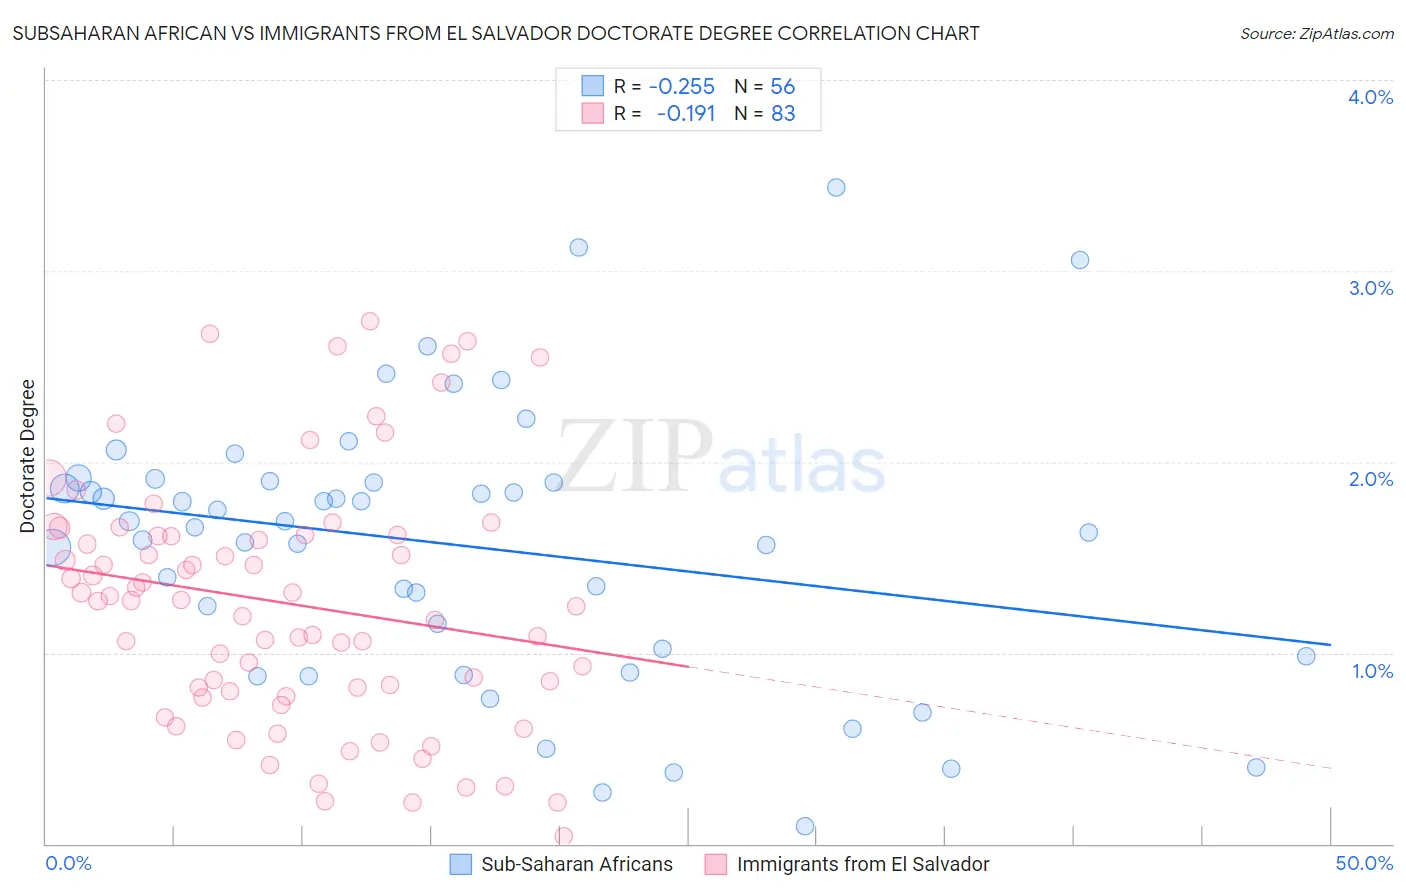
Subsaharan African vs Immigrants from El Salvador Doctorate Degree Correlation Chart
The statistical analysis conducted on geographies consisting of 497,272,855 people shows a weak negative correlation between the proportion of Sub-Saharan Africans and percentage of population with at least doctorate degree education in the United States with a correlation coefficient (R) of -0.255 and weighted average of 1.8%. Similarly, the statistical analysis conducted on geographies consisting of 353,263,202 people shows a poor negative correlation between the proportion of Immigrants from El Salvador and percentage of population with at least doctorate degree education in the United States with a correlation coefficient (R) of -0.191 and weighted average of 1.4%, a difference of 21.9%.
Doctorate Degree Correlation Summary
| Measurement | Subsaharan African | Immigrants from El Salvador |
| Minimum | 0.094% | 0.038% |
| Maximum | 3.4% | 2.7% |
| Range | 3.3% | 2.7% |
| Mean | 1.6% | 1.3% |
| Median | 1.7% | 1.3% |
| Interquartile 25% (IQ1) | 1.0% | 0.80% |
| Interquartile 75% (IQ3) | 1.9% | 1.6% |
| Interquartile Range (IQR) | 0.89% | 0.82% |
| Standard Deviation (Sample) | 0.72% | 0.65% |
| Standard Deviation (Population) | 0.71% | 0.64% |
Similar Demographics by Doctorate Degree
Demographics Similar to Sub-Saharan Africans by Doctorate Degree
In terms of doctorate degree, the demographic groups most similar to Sub-Saharan Africans are Chinese (1.8%, a difference of 0.0%), Immigrants from Somalia (1.8%, a difference of 0.070%), Immigrants from Ghana (1.8%, a difference of 0.090%), Uruguayan (1.8%, a difference of 0.22%), and Immigrants from South America (1.8%, a difference of 0.38%).
| Demographics | Rating | Rank | Doctorate Degree |
| French Canadians | 30.2 /100 | #189 | Fair 1.8% |
| Immigrants | Costa Rica | 30.2 /100 | #190 | Fair 1.8% |
| South Americans | 29.5 /100 | #191 | Fair 1.8% |
| Dutch | 27.4 /100 | #192 | Fair 1.8% |
| German Russians | 27.1 /100 | #193 | Fair 1.8% |
| Uruguayans | 26.2 /100 | #194 | Fair 1.8% |
| Immigrants | Somalia | 25.4 /100 | #195 | Fair 1.8% |
| Sub-Saharan Africans | 25.1 /100 | #196 | Fair 1.8% |
| Chinese | 25.1 /100 | #197 | Fair 1.8% |
| Immigrants | Ghana | 24.6 /100 | #198 | Fair 1.8% |
| Immigrants | South America | 23.3 /100 | #199 | Fair 1.8% |
| Whites/Caucasians | 22.8 /100 | #200 | Fair 1.8% |
| Immigrants | Nigeria | 22.4 /100 | #201 | Fair 1.8% |
| Portuguese | 21.4 /100 | #202 | Fair 1.8% |
| Immigrants | Vietnam | 21.4 /100 | #203 | Fair 1.8% |
Demographics Similar to Immigrants from El Salvador by Doctorate Degree
In terms of doctorate degree, the demographic groups most similar to Immigrants from El Salvador are Cape Verdean (1.4%, a difference of 0.14%), Choctaw (1.4%, a difference of 0.15%), Cajun (1.5%, a difference of 0.18%), Cherokee (1.5%, a difference of 0.34%), and Black/African American (1.4%, a difference of 0.38%).
| Demographics | Rating | Rank | Doctorate Degree |
| Tohono O'odham | 0.4 /100 | #281 | Tragic 1.5% |
| British West Indians | 0.3 /100 | #282 | Tragic 1.5% |
| Central Americans | 0.3 /100 | #283 | Tragic 1.5% |
| Jamaicans | 0.3 /100 | #284 | Tragic 1.5% |
| Malaysians | 0.3 /100 | #285 | Tragic 1.5% |
| Cherokee | 0.3 /100 | #286 | Tragic 1.5% |
| Cajuns | 0.3 /100 | #287 | Tragic 1.5% |
| Immigrants | El Salvador | 0.3 /100 | #288 | Tragic 1.4% |
| Cape Verdeans | 0.3 /100 | #289 | Tragic 1.4% |
| Choctaw | 0.3 /100 | #290 | Tragic 1.4% |
| Blacks/African Americans | 0.3 /100 | #291 | Tragic 1.4% |
| Alaska Natives | 0.3 /100 | #292 | Tragic 1.4% |
| Immigrants | Yemen | 0.2 /100 | #293 | Tragic 1.4% |
| Samoans | 0.2 /100 | #294 | Tragic 1.4% |
| Guatemalans | 0.2 /100 | #295 | Tragic 1.4% |