Subsaharan African vs Immigrants from Egypt High School Diploma
COMPARE
Subsaharan African
Immigrants from Egypt
High School Diploma
High School Diploma Comparison
Sub-Saharan Africans
Immigrants from Egypt
87.9%
HIGH SCHOOL DIPLOMA
2.8/ 100
METRIC RATING
236th/ 347
METRIC RANK
89.6%
HIGH SCHOOL DIPLOMA
81.2/ 100
METRIC RATING
140th/ 347
METRIC RANK
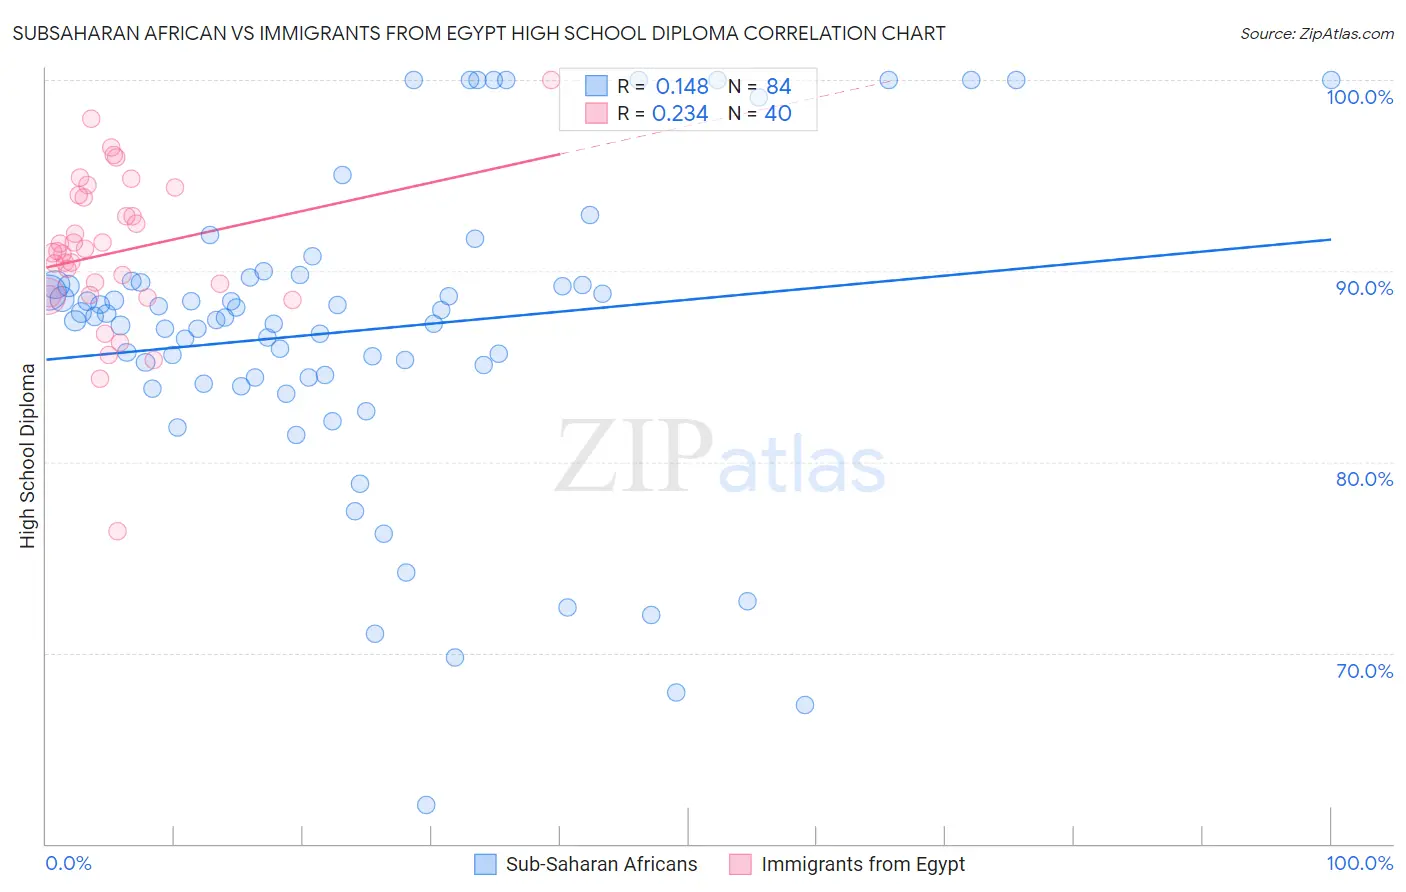
Subsaharan African vs Immigrants from Egypt High School Diploma Correlation Chart
The statistical analysis conducted on geographies consisting of 508,219,008 people shows a poor positive correlation between the proportion of Sub-Saharan Africans and percentage of population with at least high school diploma education in the United States with a correlation coefficient (R) of 0.148 and weighted average of 87.9%. Similarly, the statistical analysis conducted on geographies consisting of 245,484,455 people shows a weak positive correlation between the proportion of Immigrants from Egypt and percentage of population with at least high school diploma education in the United States with a correlation coefficient (R) of 0.234 and weighted average of 89.6%, a difference of 1.9%.
High School Diploma Correlation Summary
| Measurement | Subsaharan African | Immigrants from Egypt |
| Minimum | 62.1% | 76.3% |
| Maximum | 100.0% | 100.0% |
| Range | 37.9% | 23.7% |
| Mean | 86.9% | 91.0% |
| Median | 87.6% | 91.0% |
| Interquartile 25% (IQ1) | 84.4% | 88.7% |
| Interquartile 75% (IQ3) | 89.4% | 93.9% |
| Interquartile Range (IQR) | 5.0% | 5.2% |
| Standard Deviation (Sample) | 8.1% | 4.2% |
| Standard Deviation (Population) | 8.0% | 4.2% |
Similar Demographics by High School Diploma
Demographics Similar to Sub-Saharan Africans by High School Diploma
In terms of high school diploma, the demographic groups most similar to Sub-Saharan Africans are Taiwanese (87.9%, a difference of 0.010%), Sioux (87.9%, a difference of 0.010%), South American (87.9%, a difference of 0.010%), Immigrants from Bahamas (88.0%, a difference of 0.020%), and Immigrants from Panama (88.0%, a difference of 0.040%).
| Demographics | Rating | Rank | High School Diploma |
| Nigerians | 5.2 /100 | #229 | Tragic 88.2% |
| Blackfeet | 4.2 /100 | #230 | Tragic 88.1% |
| Colombians | 3.8 /100 | #231 | Tragic 88.1% |
| Immigrants | Middle Africa | 3.4 /100 | #232 | Tragic 88.0% |
| Immigrants | Panama | 3.1 /100 | #233 | Tragic 88.0% |
| Immigrants | Thailand | 3.1 /100 | #234 | Tragic 88.0% |
| Immigrants | Bahamas | 2.9 /100 | #235 | Tragic 88.0% |
| Sub-Saharan Africans | 2.8 /100 | #236 | Tragic 87.9% |
| Taiwanese | 2.8 /100 | #237 | Tragic 87.9% |
| Sioux | 2.7 /100 | #238 | Tragic 87.9% |
| South Americans | 2.7 /100 | #239 | Tragic 87.9% |
| Comanche | 2.2 /100 | #240 | Tragic 87.9% |
| Immigrants | Uzbekistan | 2.1 /100 | #241 | Tragic 87.8% |
| Cheyenne | 2.1 /100 | #242 | Tragic 87.8% |
| Immigrants | Philippines | 1.9 /100 | #243 | Tragic 87.8% |
Demographics Similar to Immigrants from Egypt by High School Diploma
In terms of high school diploma, the demographic groups most similar to Immigrants from Egypt are Kenyan (89.6%, a difference of 0.010%), Assyrian/Chaldean/Syriac (89.7%, a difference of 0.030%), Chilean (89.6%, a difference of 0.050%), Arab (89.7%, a difference of 0.060%), and Indian (Asian) (89.6%, a difference of 0.060%).
| Demographics | Rating | Rank | High School Diploma |
| Albanians | 87.2 /100 | #133 | Excellent 89.8% |
| Immigrants | Jordan | 87.2 /100 | #134 | Excellent 89.8% |
| Chippewa | 85.6 /100 | #135 | Excellent 89.7% |
| Ugandans | 83.7 /100 | #136 | Excellent 89.7% |
| Arabs | 83.6 /100 | #137 | Excellent 89.7% |
| Assyrians/Chaldeans/Syriacs | 82.5 /100 | #138 | Excellent 89.7% |
| Kenyans | 81.4 /100 | #139 | Excellent 89.6% |
| Immigrants | Egypt | 81.2 /100 | #140 | Excellent 89.6% |
| Chileans | 79.0 /100 | #141 | Good 89.6% |
| Indians (Asian) | 78.8 /100 | #142 | Good 89.6% |
| Pakistanis | 78.3 /100 | #143 | Good 89.6% |
| Immigrants | Kenya | 78.0 /100 | #144 | Good 89.6% |
| Immigrants | Brazil | 76.6 /100 | #145 | Good 89.5% |
| Immigrants | Spain | 76.2 /100 | #146 | Good 89.5% |
| Iraqis | 73.9 /100 | #147 | Good 89.5% |