Sri Lankan vs Mexican American Indian No Schooling Completed
COMPARE
Sri Lankan
Mexican American Indian
No Schooling Completed
No Schooling Completed Comparison
Sri Lankans
Mexican American Indians
3.0%
NO SCHOOLING COMPLETED
0.0/ 100
METRIC RATING
312th/ 347
METRIC RANK
3.2%
NO SCHOOLING COMPLETED
0.0/ 100
METRIC RATING
324th/ 347
METRIC RANK
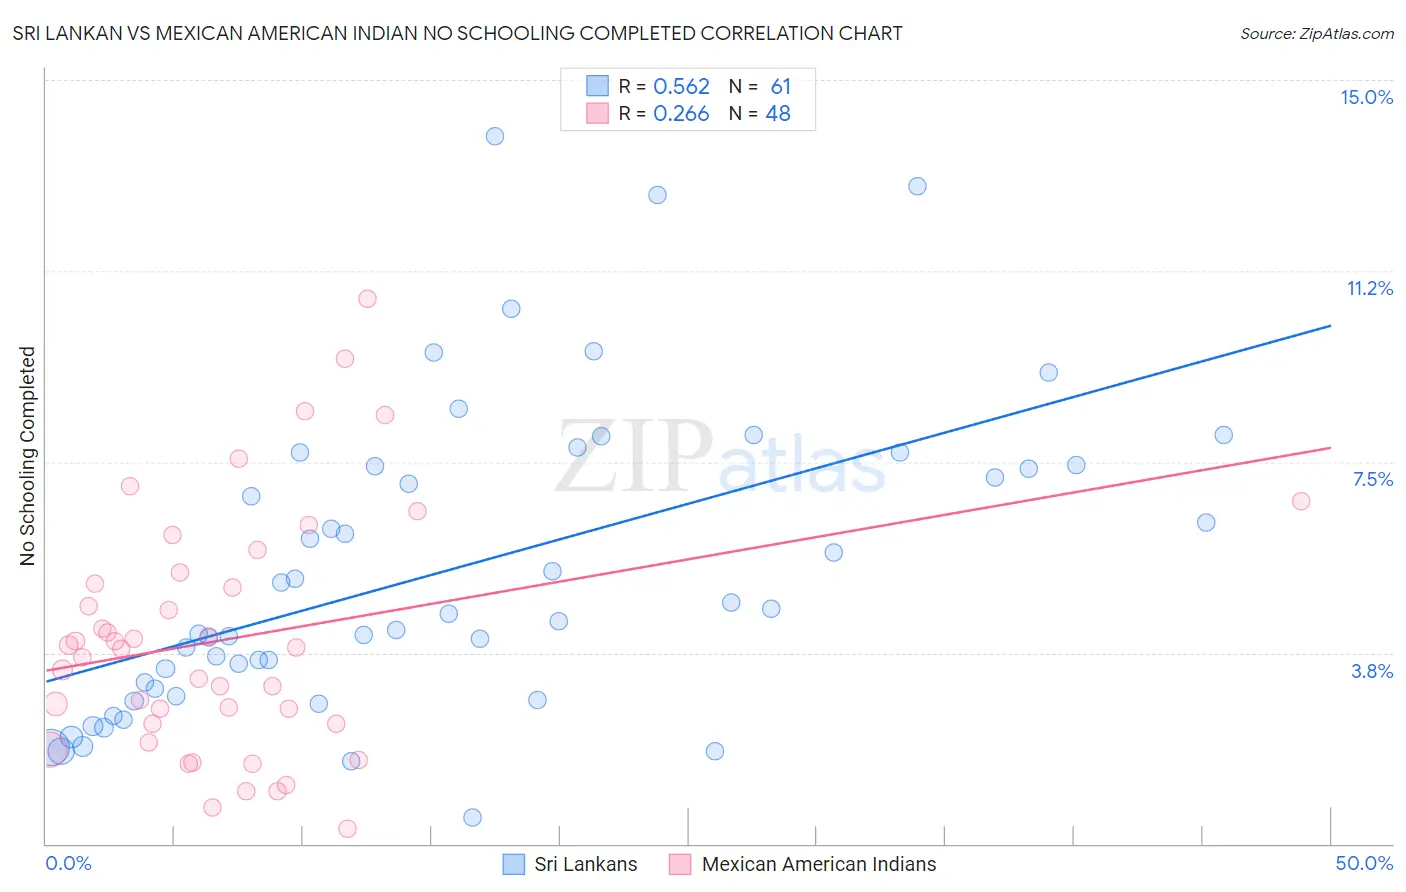
Sri Lankan vs Mexican American Indian No Schooling Completed Correlation Chart
The statistical analysis conducted on geographies consisting of 436,055,968 people shows a substantial positive correlation between the proportion of Sri Lankans and percentage of population with no schooling in the United States with a correlation coefficient (R) of 0.562 and weighted average of 3.0%. Similarly, the statistical analysis conducted on geographies consisting of 315,971,799 people shows a weak positive correlation between the proportion of Mexican American Indians and percentage of population with no schooling in the United States with a correlation coefficient (R) of 0.266 and weighted average of 3.2%, a difference of 4.5%.
No Schooling Completed Correlation Summary
| Measurement | Sri Lankan | Mexican American Indian |
| Minimum | 0.51% | 0.28% |
| Maximum | 13.9% | 10.7% |
| Range | 13.4% | 10.4% |
| Mean | 5.4% | 4.0% |
| Median | 4.5% | 3.8% |
| Interquartile 25% (IQ1) | 3.0% | 2.4% |
| Interquartile 75% (IQ3) | 7.4% | 5.2% |
| Interquartile Range (IQR) | 4.5% | 2.9% |
| Standard Deviation (Sample) | 3.0% | 2.4% |
| Standard Deviation (Population) | 3.0% | 2.4% |
Demographics Similar to Sri Lankans and Mexican American Indians by No Schooling Completed
In terms of no schooling completed, the demographic groups most similar to Sri Lankans are Immigrants from the Azores (3.0%, a difference of 0.28%), Guyanese (3.0%, a difference of 0.38%), Hispanic or Latino (3.0%, a difference of 0.43%), Honduran (3.1%, a difference of 0.51%), and Immigrants from Belize (3.1%, a difference of 0.60%). Similarly, the demographic groups most similar to Mexican American Indians are Vietnamese (3.2%, a difference of 0.34%), Immigrants from Honduras (3.2%, a difference of 0.53%), Dominican (3.2%, a difference of 0.67%), Indonesian (3.2%, a difference of 0.70%), and Immigrants from Laos (3.1%, a difference of 1.2%).
| Demographics | Rating | Rank | No Schooling Completed |
| Immigrants | Somalia | 0.0 /100 | #308 | Tragic 3.0% |
| Hispanics or Latinos | 0.0 /100 | #309 | Tragic 3.0% |
| Guyanese | 0.0 /100 | #310 | Tragic 3.0% |
| Immigrants | Azores | 0.0 /100 | #311 | Tragic 3.0% |
| Sri Lankans | 0.0 /100 | #312 | Tragic 3.0% |
| Hondurans | 0.0 /100 | #313 | Tragic 3.1% |
| Immigrants | Belize | 0.0 /100 | #314 | Tragic 3.1% |
| Immigrants | Nicaragua | 0.0 /100 | #315 | Tragic 3.1% |
| Immigrants | Ecuador | 0.0 /100 | #316 | Tragic 3.1% |
| Cape Verdeans | 0.0 /100 | #317 | Tragic 3.1% |
| Immigrants | Guyana | 0.0 /100 | #318 | Tragic 3.1% |
| Immigrants | Burma/Myanmar | 0.0 /100 | #319 | Tragic 3.1% |
| Immigrants | Bangladesh | 0.0 /100 | #320 | Tragic 3.1% |
| Immigrants | Laos | 0.0 /100 | #321 | Tragic 3.1% |
| Immigrants | Honduras | 0.0 /100 | #322 | Tragic 3.2% |
| Vietnamese | 0.0 /100 | #323 | Tragic 3.2% |
| Mexican American Indians | 0.0 /100 | #324 | Tragic 3.2% |
| Dominicans | 0.0 /100 | #325 | Tragic 3.2% |
| Indonesians | 0.0 /100 | #326 | Tragic 3.2% |
| Immigrants | Latin America | 0.0 /100 | #327 | Tragic 3.3% |
| Mexicans | 0.0 /100 | #328 | Tragic 3.3% |