Spanish vs Sri Lankan 10th Grade
COMPARE
Spanish
Sri Lankan
10th Grade
10th Grade Comparison
Spanish
Sri Lankans
94.0%
10TH GRADE
74.9/ 100
METRIC RATING
155th/ 347
METRIC RANK
91.8%
10TH GRADE
0.0/ 100
METRIC RATING
289th/ 347
METRIC RANK
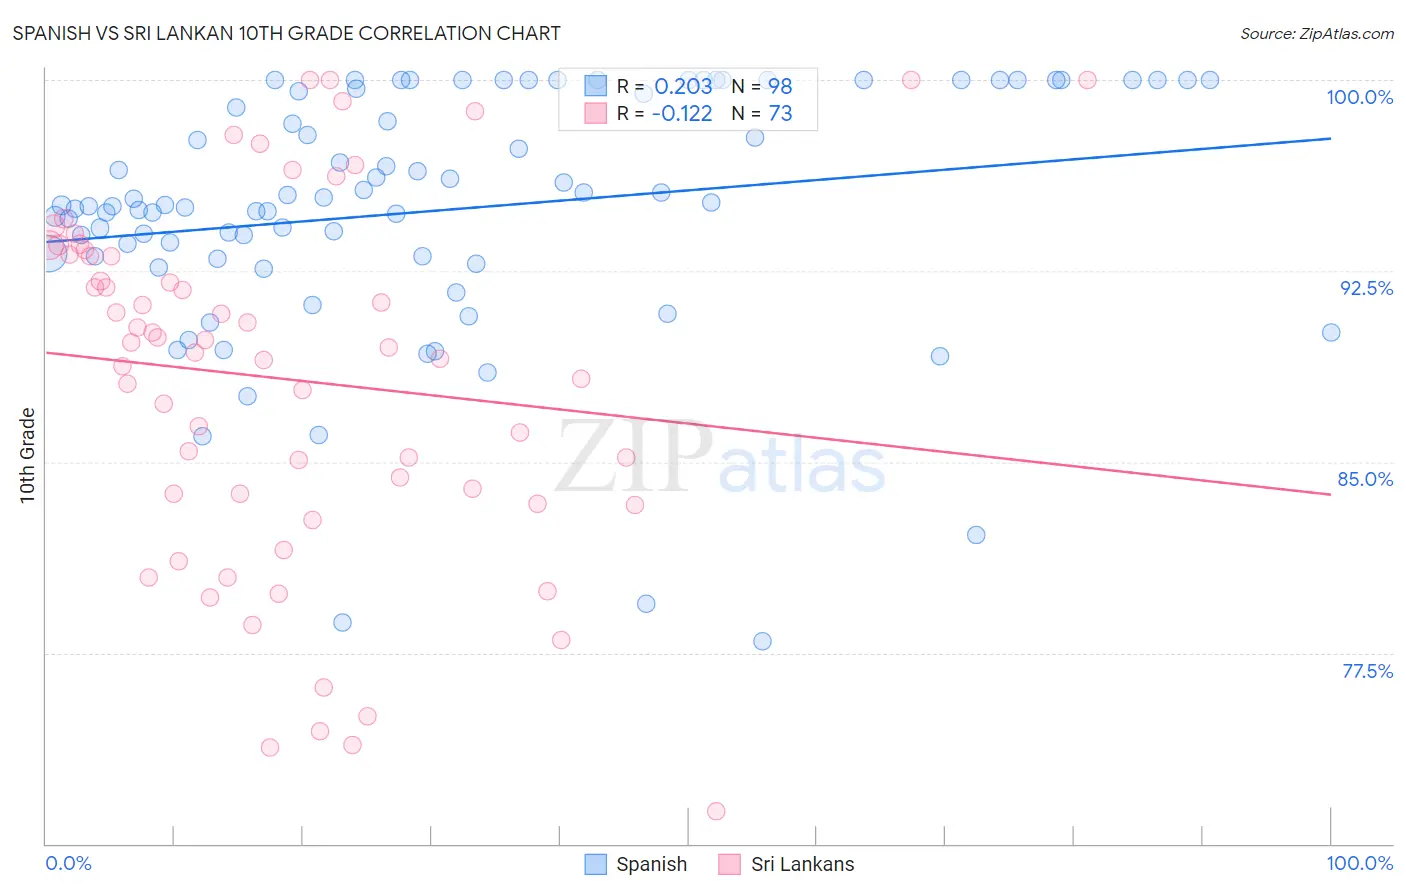
Spanish vs Sri Lankan 10th Grade Correlation Chart
The statistical analysis conducted on geographies consisting of 422,189,188 people shows a weak positive correlation between the proportion of Spanish and percentage of population with at least 10th grade education in the United States with a correlation coefficient (R) of 0.203 and weighted average of 94.0%. Similarly, the statistical analysis conducted on geographies consisting of 440,593,537 people shows a poor negative correlation between the proportion of Sri Lankans and percentage of population with at least 10th grade education in the United States with a correlation coefficient (R) of -0.122 and weighted average of 91.8%, a difference of 2.3%.
10th Grade Correlation Summary
| Measurement | Spanish | Sri Lankan |
| Minimum | 77.9% | 71.3% |
| Maximum | 100.0% | 100.0% |
| Range | 22.1% | 28.7% |
| Mean | 94.9% | 88.2% |
| Median | 95.1% | 89.5% |
| Interquartile 25% (IQ1) | 93.1% | 83.6% |
| Interquartile 75% (IQ3) | 99.7% | 93.2% |
| Interquartile Range (IQR) | 6.6% | 9.7% |
| Standard Deviation (Sample) | 4.9% | 7.1% |
| Standard Deviation (Population) | 4.8% | 7.0% |
Similar Demographics by 10th Grade
Demographics Similar to Spanish by 10th Grade
In terms of 10th grade, the demographic groups most similar to Spanish are Immigrants from Kenya (94.0%, a difference of 0.0%), Immigrants from Brazil (94.0%, a difference of 0.010%), Mongolian (94.0%, a difference of 0.010%), Kiowa (93.9%, a difference of 0.020%), and Immigrants from Italy (94.0%, a difference of 0.040%).
| Demographics | Rating | Rank | 10th Grade |
| Arabs | 80.9 /100 | #148 | Excellent 94.0% |
| Ugandans | 80.7 /100 | #149 | Excellent 94.0% |
| Egyptians | 79.6 /100 | #150 | Good 94.0% |
| Kenyans | 79.1 /100 | #151 | Good 94.0% |
| Immigrants | Italy | 78.0 /100 | #152 | Good 94.0% |
| Immigrants | Brazil | 75.5 /100 | #153 | Good 94.0% |
| Immigrants | Kenya | 75.3 /100 | #154 | Good 94.0% |
| Spanish | 74.9 /100 | #155 | Good 94.0% |
| Mongolians | 74.4 /100 | #156 | Good 94.0% |
| Kiowa | 73.3 /100 | #157 | Good 93.9% |
| Bermudans | 71.0 /100 | #158 | Good 93.9% |
| Chileans | 70.2 /100 | #159 | Good 93.9% |
| Pakistanis | 70.1 /100 | #160 | Good 93.9% |
| Assyrians/Chaldeans/Syriacs | 69.7 /100 | #161 | Good 93.9% |
| Immigrants | Poland | 69.6 /100 | #162 | Good 93.9% |
Demographics Similar to Sri Lankans by 10th Grade
In terms of 10th grade, the demographic groups most similar to Sri Lankans are British West Indian (91.8%, a difference of 0.020%), Immigrants from West Indies (91.8%, a difference of 0.030%), Immigrants from Burma/Myanmar (91.8%, a difference of 0.030%), Pennsylvania German (91.9%, a difference of 0.040%), and Immigrants from Laos (91.9%, a difference of 0.040%).
| Demographics | Rating | Rank | 10th Grade |
| Immigrants | Peru | 0.1 /100 | #282 | Tragic 92.2% |
| Immigrants | St. Vincent and the Grenadines | 0.0 /100 | #283 | Tragic 92.1% |
| Immigrants | Barbados | 0.0 /100 | #284 | Tragic 92.1% |
| Immigrants | South Eastern Asia | 0.0 /100 | #285 | Tragic 92.1% |
| Yuman | 0.0 /100 | #286 | Tragic 92.0% |
| Pennsylvania Germans | 0.0 /100 | #287 | Tragic 91.9% |
| Immigrants | Laos | 0.0 /100 | #288 | Tragic 91.9% |
| Sri Lankans | 0.0 /100 | #289 | Tragic 91.8% |
| British West Indians | 0.0 /100 | #290 | Tragic 91.8% |
| Immigrants | West Indies | 0.0 /100 | #291 | Tragic 91.8% |
| Immigrants | Burma/Myanmar | 0.0 /100 | #292 | Tragic 91.8% |
| Indonesians | 0.0 /100 | #293 | Tragic 91.8% |
| Haitians | 0.0 /100 | #294 | Tragic 91.8% |
| Lumbee | 0.0 /100 | #295 | Tragic 91.7% |
| Immigrants | Grenada | 0.0 /100 | #296 | Tragic 91.6% |