Spanish vs Ottawa 11th Grade
COMPARE
Spanish
Ottawa
11th Grade
11th Grade Comparison
Spanish
Ottawa
92.7%
11TH GRADE
66.2/ 100
METRIC RATING
164th/ 347
METRIC RANK
93.6%
11TH GRADE
99.2/ 100
METRIC RATING
90th/ 347
METRIC RANK
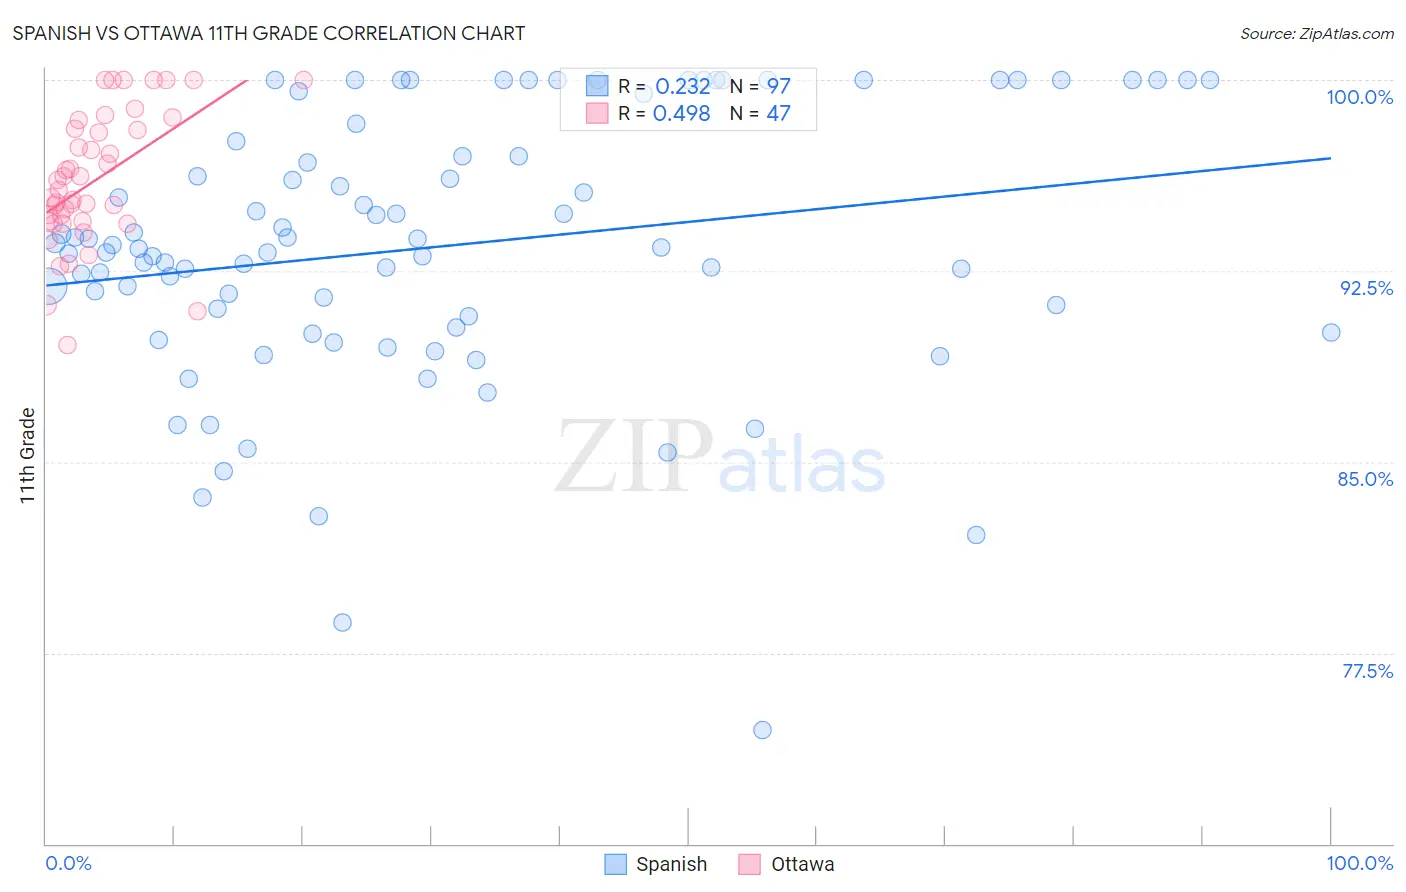
Spanish vs Ottawa 11th Grade Correlation Chart
The statistical analysis conducted on geographies consisting of 422,188,828 people shows a weak positive correlation between the proportion of Spanish and percentage of population with at least 11th grade education in the United States with a correlation coefficient (R) of 0.232 and weighted average of 92.7%. Similarly, the statistical analysis conducted on geographies consisting of 49,956,602 people shows a moderate positive correlation between the proportion of Ottawa and percentage of population with at least 11th grade education in the United States with a correlation coefficient (R) of 0.498 and weighted average of 93.6%, a difference of 1.0%.
11th Grade Correlation Summary
| Measurement | Spanish | Ottawa |
| Minimum | 74.4% | 89.6% |
| Maximum | 100.0% | 100.0% |
| Range | 25.6% | 10.4% |
| Mean | 93.5% | 96.1% |
| Median | 93.4% | 95.7% |
| Interquartile 25% (IQ1) | 90.5% | 94.4% |
| Interquartile 75% (IQ3) | 97.9% | 98.1% |
| Interquartile Range (IQR) | 7.5% | 3.6% |
| Standard Deviation (Sample) | 5.3% | 2.6% |
| Standard Deviation (Population) | 5.2% | 2.6% |
Similar Demographics by 11th Grade
Demographics Similar to Spanish by 11th Grade
In terms of 11th grade, the demographic groups most similar to Spanish are Nonimmigrants (92.7%, a difference of 0.0%), Paraguayan (92.7%, a difference of 0.030%), Immigrants from Iraq (92.6%, a difference of 0.030%), Immigrants from Argentina (92.7%, a difference of 0.040%), and Bermudan (92.6%, a difference of 0.040%).
| Demographics | Rating | Rank | 11th Grade |
| Immigrants | Eastern Asia | 72.6 /100 | #157 | Good 92.7% |
| Immigrants | Venezuela | 72.0 /100 | #158 | Good 92.7% |
| Americans | 71.7 /100 | #159 | Good 92.7% |
| Immigrants | Lebanon | 70.7 /100 | #160 | Good 92.7% |
| Immigrants | Argentina | 69.8 /100 | #161 | Good 92.7% |
| Paraguayans | 68.7 /100 | #162 | Good 92.7% |
| Immigrants | Nonimmigrants | 66.6 /100 | #163 | Good 92.7% |
| Spanish | 66.2 /100 | #164 | Good 92.7% |
| Immigrants | Iraq | 63.7 /100 | #165 | Good 92.6% |
| Bermudans | 62.3 /100 | #166 | Good 92.6% |
| Alsatians | 60.2 /100 | #167 | Good 92.6% |
| Sierra Leoneans | 58.7 /100 | #168 | Average 92.6% |
| Immigrants | Albania | 57.8 /100 | #169 | Average 92.6% |
| Immigrants | Northern Africa | 57.3 /100 | #170 | Average 92.6% |
| Laotians | 54.4 /100 | #171 | Average 92.6% |
Demographics Similar to Ottawa by 11th Grade
In terms of 11th grade, the demographic groups most similar to Ottawa are Immigrants from South Central Asia (93.6%, a difference of 0.010%), Immigrants from Western Europe (93.6%, a difference of 0.010%), Cambodian (93.6%, a difference of 0.010%), Burmese (93.6%, a difference of 0.010%), and South African (93.6%, a difference of 0.010%).
| Demographics | Rating | Rank | 11th Grade |
| Icelanders | 99.3 /100 | #83 | Exceptional 93.6% |
| Immigrants | Taiwan | 99.3 /100 | #84 | Exceptional 93.6% |
| Immigrants | Switzerland | 99.3 /100 | #85 | Exceptional 93.6% |
| Immigrants | South Central Asia | 99.2 /100 | #86 | Exceptional 93.6% |
| Immigrants | Western Europe | 99.2 /100 | #87 | Exceptional 93.6% |
| Cambodians | 99.2 /100 | #88 | Exceptional 93.6% |
| Burmese | 99.2 /100 | #89 | Exceptional 93.6% |
| Ottawa | 99.2 /100 | #90 | Exceptional 93.6% |
| South Africans | 99.2 /100 | #91 | Exceptional 93.6% |
| Immigrants | Bulgaria | 99.1 /100 | #92 | Exceptional 93.6% |
| Puget Sound Salish | 99.1 /100 | #93 | Exceptional 93.6% |
| Swiss | 99.0 /100 | #94 | Exceptional 93.6% |
| Immigrants | France | 99.0 /100 | #95 | Exceptional 93.6% |
| Immigrants | Turkey | 98.9 /100 | #96 | Exceptional 93.5% |
| Immigrants | Iran | 98.9 /100 | #97 | Exceptional 93.5% |