Spanish vs Macedonian College, Under 1 year
COMPARE
Spanish
Macedonian
College, Under 1 year
College, Under 1 year Comparison
Spanish
Macedonians
64.9%
COLLEGE, UNDER 1 YEAR
31.6/ 100
METRIC RATING
189th/ 347
METRIC RANK
67.6%
COLLEGE, UNDER 1 YEAR
95.7/ 100
METRIC RATING
112th/ 347
METRIC RANK
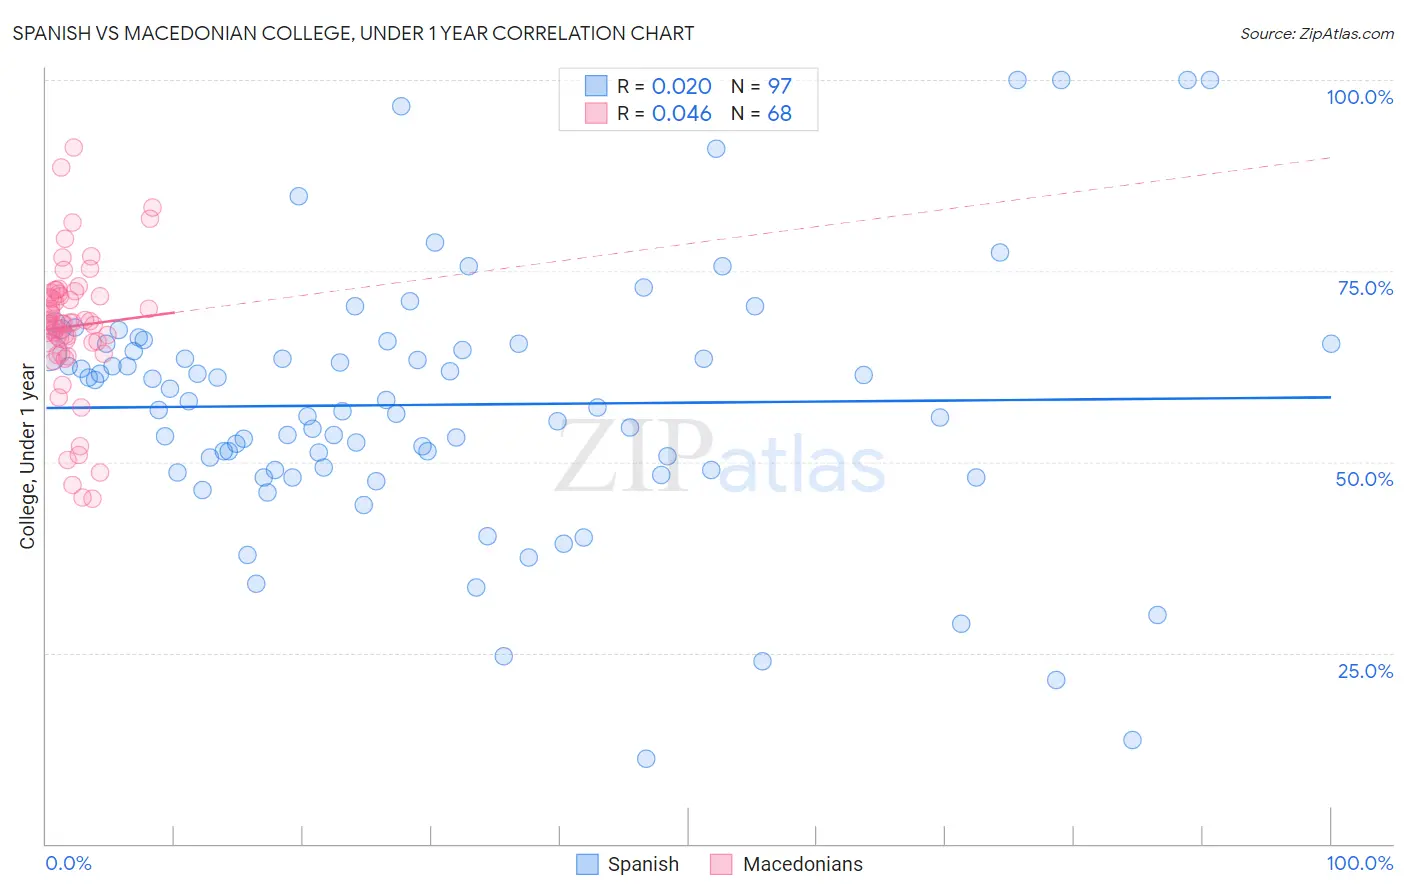
Spanish vs Macedonian College, Under 1 year Correlation Chart
The statistical analysis conducted on geographies consisting of 422,188,866 people shows no correlation between the proportion of Spanish and percentage of population with at least college, under 1 year education in the United States with a correlation coefficient (R) of 0.020 and weighted average of 64.9%. Similarly, the statistical analysis conducted on geographies consisting of 132,646,607 people shows no correlation between the proportion of Macedonians and percentage of population with at least college, under 1 year education in the United States with a correlation coefficient (R) of 0.046 and weighted average of 67.6%, a difference of 4.3%.
College, Under 1 year Correlation Summary
| Measurement | Spanish | Macedonian |
| Minimum | 11.1% | 45.2% |
| Maximum | 100.0% | 91.1% |
| Range | 88.9% | 45.9% |
| Mean | 57.5% | 67.7% |
| Median | 57.1% | 68.1% |
| Interquartile 25% (IQ1) | 48.9% | 65.6% |
| Interquartile 75% (IQ3) | 65.5% | 71.8% |
| Interquartile Range (IQR) | 16.6% | 6.2% |
| Standard Deviation (Sample) | 17.0% | 8.9% |
| Standard Deviation (Population) | 17.0% | 8.8% |
Similar Demographics by College, Under 1 year
Demographics Similar to Spanish by College, Under 1 year
In terms of college, under 1 year, the demographic groups most similar to Spanish are Immigrants from Albania (64.9%, a difference of 0.020%), Immigrants from Philippines (64.8%, a difference of 0.080%), Immigrants from Southern Europe (64.9%, a difference of 0.14%), Immigrants from Armenia (64.7%, a difference of 0.19%), and Immigrants from Thailand (64.7%, a difference of 0.24%).
| Demographics | Rating | Rank | College, Under 1 year |
| Immigrants | Africa | 44.7 /100 | #182 | Average 65.3% |
| Immigrants | Poland | 42.6 /100 | #183 | Average 65.2% |
| Bermudans | 42.0 /100 | #184 | Average 65.2% |
| Sri Lankans | 41.7 /100 | #185 | Average 65.2% |
| Immigrants | Sierra Leone | 39.7 /100 | #186 | Fair 65.1% |
| Immigrants | Southern Europe | 34.3 /100 | #187 | Fair 64.9% |
| Immigrants | Albania | 32.0 /100 | #188 | Fair 64.9% |
| Spanish | 31.6 /100 | #189 | Fair 64.9% |
| Immigrants | Philippines | 30.1 /100 | #190 | Fair 64.8% |
| Immigrants | Armenia | 28.1 /100 | #191 | Fair 64.7% |
| Immigrants | Thailand | 27.0 /100 | #192 | Fair 64.7% |
| Slovaks | 26.7 /100 | #193 | Fair 64.7% |
| Immigrants | Cameroon | 24.6 /100 | #194 | Fair 64.6% |
| Immigrants | South Eastern Asia | 22.1 /100 | #195 | Fair 64.5% |
| Tongans | 21.2 /100 | #196 | Fair 64.5% |
Demographics Similar to Macedonians by College, Under 1 year
In terms of college, under 1 year, the demographic groups most similar to Macedonians are Scandinavian (67.7%, a difference of 0.020%), Assyrian/Chaldean/Syriac (67.7%, a difference of 0.020%), Ukrainian (67.7%, a difference of 0.020%), Syrian (67.6%, a difference of 0.030%), and Immigrants from Egypt (67.7%, a difference of 0.080%).
| Demographics | Rating | Rank | College, Under 1 year |
| Afghans | 96.6 /100 | #105 | Exceptional 67.8% |
| Immigrants | Croatia | 96.6 /100 | #106 | Exceptional 67.8% |
| Austrians | 96.4 /100 | #107 | Exceptional 67.8% |
| Immigrants | Egypt | 96.0 /100 | #108 | Exceptional 67.7% |
| Scandinavians | 95.8 /100 | #109 | Exceptional 67.7% |
| Assyrians/Chaldeans/Syriacs | 95.8 /100 | #110 | Exceptional 67.7% |
| Ukrainians | 95.8 /100 | #111 | Exceptional 67.7% |
| Macedonians | 95.7 /100 | #112 | Exceptional 67.6% |
| Syrians | 95.6 /100 | #113 | Exceptional 67.6% |
| Chileans | 95.3 /100 | #114 | Exceptional 67.6% |
| Basques | 95.2 /100 | #115 | Exceptional 67.6% |
| Immigrants | Nepal | 94.9 /100 | #116 | Exceptional 67.5% |
| Pakistanis | 94.8 /100 | #117 | Exceptional 67.5% |
| Immigrants | Ukraine | 94.7 /100 | #118 | Exceptional 67.5% |
| Lebanese | 94.6 /100 | #119 | Exceptional 67.5% |