Spanish vs Cambodian 9th Grade
COMPARE
Spanish
Cambodian
9th Grade
9th Grade Comparison
Spanish
Cambodians
95.2%
9TH GRADE
84.4/ 100
METRIC RATING
143rd/ 347
METRIC RANK
95.4%
9TH GRADE
95.6/ 100
METRIC RATING
120th/ 347
METRIC RANK
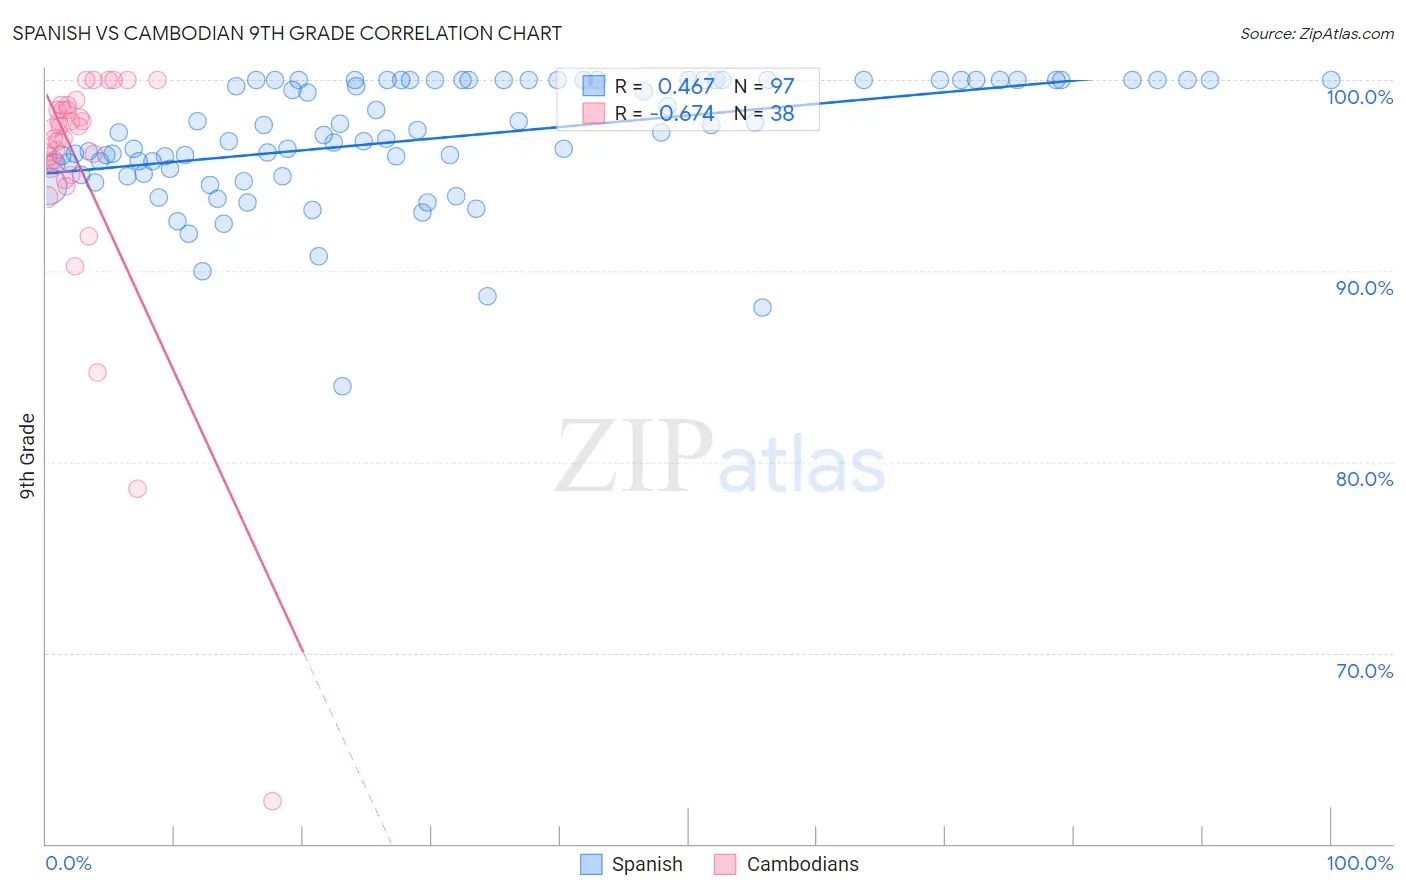
Spanish vs Cambodian 9th Grade Correlation Chart
The statistical analysis conducted on geographies consisting of 422,188,828 people shows a moderate positive correlation between the proportion of Spanish and percentage of population with at least 9th grade education in the United States with a correlation coefficient (R) of 0.467 and weighted average of 95.2%. Similarly, the statistical analysis conducted on geographies consisting of 102,514,976 people shows a significant negative correlation between the proportion of Cambodians and percentage of population with at least 9th grade education in the United States with a correlation coefficient (R) of -0.674 and weighted average of 95.4%, a difference of 0.26%.
9th Grade Correlation Summary
| Measurement | Spanish | Cambodian |
| Minimum | 84.0% | 62.2% |
| Maximum | 100.0% | 100.0% |
| Range | 16.0% | 37.8% |
| Mean | 97.0% | 95.4% |
| Median | 97.3% | 97.2% |
| Interquartile 25% (IQ1) | 95.2% | 95.4% |
| Interquartile 75% (IQ3) | 100.0% | 98.4% |
| Interquartile Range (IQR) | 4.8% | 3.1% |
| Standard Deviation (Sample) | 3.2% | 6.9% |
| Standard Deviation (Population) | 3.2% | 6.8% |
Similar Demographics by 9th Grade
Demographics Similar to Spanish by 9th Grade
In terms of 9th grade, the demographic groups most similar to Spanish are Immigrants from Greece (95.2%, a difference of 0.0%), Immigrants from Taiwan (95.2%, a difference of 0.010%), Immigrants from Bosnia and Herzegovina (95.2%, a difference of 0.010%), Yup'ik (95.2%, a difference of 0.010%), and Immigrants from Eastern Europe (95.2%, a difference of 0.020%).
| Demographics | Rating | Rank | 9th Grade |
| Immigrants | Iran | 88.3 /100 | #136 | Excellent 95.2% |
| Hmong | 87.7 /100 | #137 | Excellent 95.2% |
| Immigrants | Russia | 86.6 /100 | #138 | Excellent 95.2% |
| Immigrants | Eastern Europe | 85.8 /100 | #139 | Excellent 95.2% |
| Immigrants | Taiwan | 85.3 /100 | #140 | Excellent 95.2% |
| Immigrants | Bosnia and Herzegovina | 85.2 /100 | #141 | Excellent 95.2% |
| Immigrants | Greece | 84.6 /100 | #142 | Excellent 95.2% |
| Spanish | 84.4 /100 | #143 | Excellent 95.2% |
| Yup'ik | 83.3 /100 | #144 | Excellent 95.2% |
| Pueblo | 82.2 /100 | #145 | Excellent 95.1% |
| Immigrants | Sri Lanka | 82.1 /100 | #146 | Excellent 95.1% |
| Choctaw | 81.9 /100 | #147 | Excellent 95.1% |
| Immigrants | Jordan | 81.2 /100 | #148 | Excellent 95.1% |
| Immigrants | Korea | 79.6 /100 | #149 | Good 95.1% |
| Kenyans | 79.1 /100 | #150 | Good 95.1% |
Demographics Similar to Cambodians by 9th Grade
In terms of 9th grade, the demographic groups most similar to Cambodians are Immigrants from Europe (95.4%, a difference of 0.0%), Immigrants from Romania (95.4%, a difference of 0.0%), Immigrants from Turkey (95.4%, a difference of 0.0%), Soviet Union (95.4%, a difference of 0.0%), and Cree (95.4%, a difference of 0.0%).
| Demographics | Rating | Rank | 9th Grade |
| Iroquois | 96.2 /100 | #113 | Exceptional 95.4% |
| German Russians | 96.1 /100 | #114 | Exceptional 95.4% |
| Burmese | 96.0 /100 | #115 | Exceptional 95.4% |
| Immigrants | Europe | 95.7 /100 | #116 | Exceptional 95.4% |
| Immigrants | Romania | 95.6 /100 | #117 | Exceptional 95.4% |
| Immigrants | Turkey | 95.6 /100 | #118 | Exceptional 95.4% |
| Soviet Union | 95.6 /100 | #119 | Exceptional 95.4% |
| Cambodians | 95.6 /100 | #120 | Exceptional 95.4% |
| Cree | 95.5 /100 | #121 | Exceptional 95.4% |
| Immigrants | Kuwait | 95.5 /100 | #122 | Exceptional 95.4% |
| Kiowa | 95.3 /100 | #123 | Exceptional 95.4% |
| Shoshone | 95.3 /100 | #124 | Exceptional 95.4% |
| Immigrants | South Central Asia | 95.1 /100 | #125 | Exceptional 95.4% |
| Immigrants | Serbia | 94.4 /100 | #126 | Exceptional 95.4% |
| Palestinians | 94.3 /100 | #127 | Exceptional 95.4% |