Spanish American vs Tohono O'odham Master's Degree
COMPARE
Spanish American
Tohono O'odham
Master's Degree
Master's Degree Comparison
Spanish Americans
Tohono O'odham
13.0%
MASTER'S DEGREE
1.9/ 100
METRIC RATING
242nd/ 347
METRIC RANK
9.7%
MASTER'S DEGREE
0.0/ 100
METRIC RATING
338th/ 347
METRIC RANK
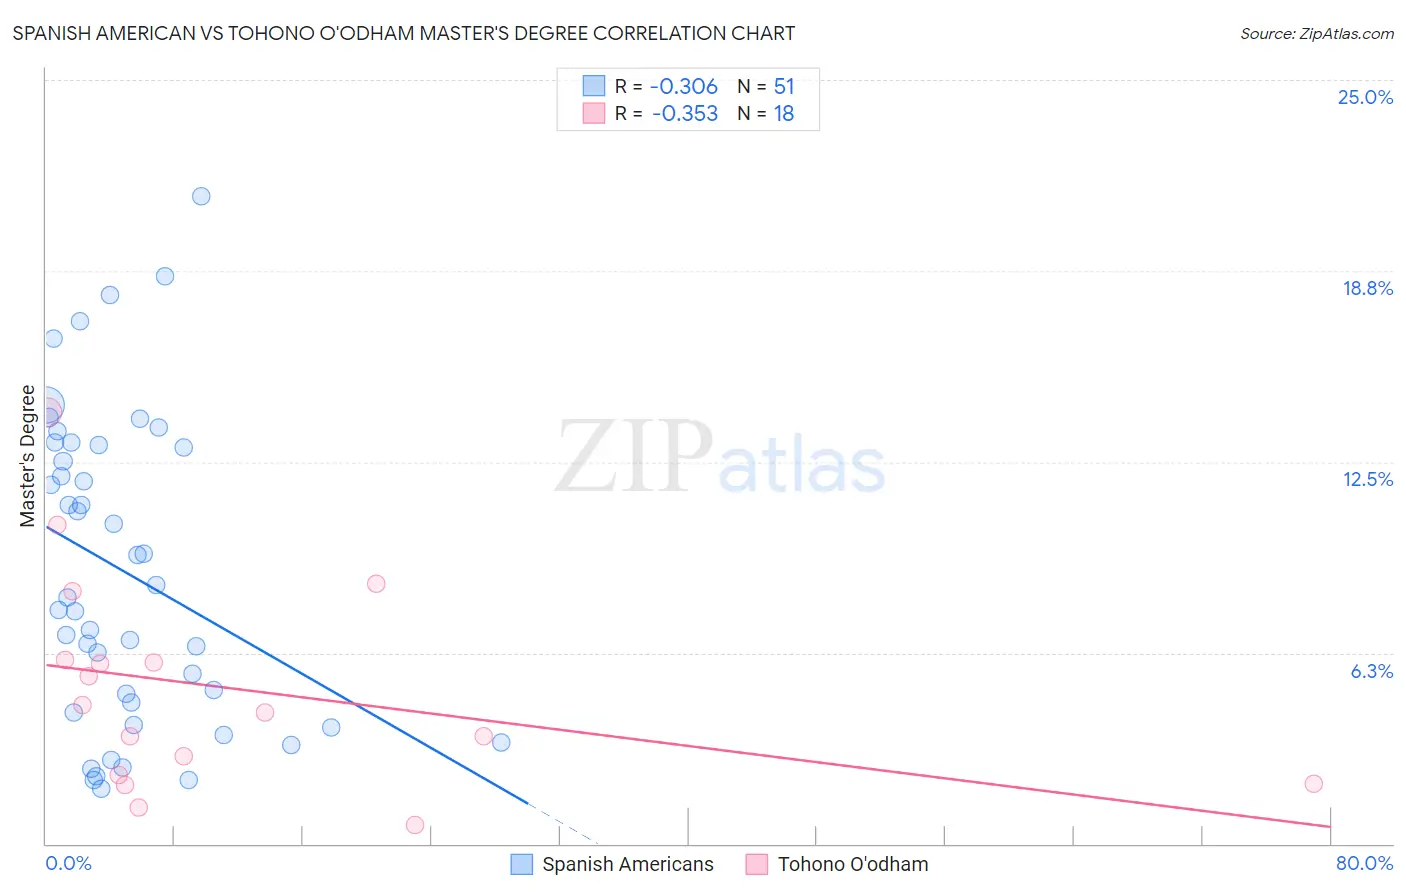
Spanish American vs Tohono O'odham Master's Degree Correlation Chart
The statistical analysis conducted on geographies consisting of 103,160,270 people shows a mild negative correlation between the proportion of Spanish Americans and percentage of population with at least master's degree education in the United States with a correlation coefficient (R) of -0.306 and weighted average of 13.0%. Similarly, the statistical analysis conducted on geographies consisting of 58,714,512 people shows a mild negative correlation between the proportion of Tohono O'odham and percentage of population with at least master's degree education in the United States with a correlation coefficient (R) of -0.353 and weighted average of 9.7%, a difference of 34.4%.
Master's Degree Correlation Summary
| Measurement | Spanish American | Tohono O'odham |
| Minimum | 1.8% | 0.61% |
| Maximum | 21.2% | 14.1% |
| Range | 19.4% | 13.5% |
| Mean | 8.9% | 5.1% |
| Median | 8.0% | 4.4% |
| Interquartile 25% (IQ1) | 4.3% | 2.3% |
| Interquartile 75% (IQ3) | 13.1% | 6.0% |
| Interquartile Range (IQR) | 8.8% | 3.7% |
| Standard Deviation (Sample) | 5.0% | 3.5% |
| Standard Deviation (Population) | 5.0% | 3.4% |
Similar Demographics by Master's Degree
Demographics Similar to Spanish Americans by Master's Degree
In terms of master's degree, the demographic groups most similar to Spanish Americans are Immigrants from Jamaica (13.0%, a difference of 0.040%), U.S. Virgin Islander (13.1%, a difference of 0.28%), Delaware (13.0%, a difference of 0.42%), Guamanian/Chamorro (13.1%, a difference of 0.43%), and Immigrants from Bahamas (12.9%, a difference of 1.1%).
| Demographics | Rating | Rank | Master's Degree |
| German Russians | 4.5 /100 | #235 | Tragic 13.5% |
| Immigrants | Guyana | 4.4 /100 | #236 | Tragic 13.4% |
| Jamaicans | 4.1 /100 | #237 | Tragic 13.4% |
| Hmong | 4.0 /100 | #238 | Tragic 13.4% |
| Immigrants | Nonimmigrants | 3.4 /100 | #239 | Tragic 13.3% |
| Guamanians/Chamorros | 2.2 /100 | #240 | Tragic 13.1% |
| U.S. Virgin Islanders | 2.1 /100 | #241 | Tragic 13.1% |
| Spanish Americans | 1.9 /100 | #242 | Tragic 13.0% |
| Immigrants | Jamaica | 1.9 /100 | #243 | Tragic 13.0% |
| Delaware | 1.7 /100 | #244 | Tragic 13.0% |
| Immigrants | Bahamas | 1.4 /100 | #245 | Tragic 12.9% |
| Immigrants | Cambodia | 1.4 /100 | #246 | Tragic 12.9% |
| Iroquois | 1.4 /100 | #247 | Tragic 12.9% |
| Africans | 1.4 /100 | #248 | Tragic 12.9% |
| Cree | 1.3 /100 | #249 | Tragic 12.8% |
Demographics Similar to Tohono O'odham by Master's Degree
In terms of master's degree, the demographic groups most similar to Tohono O'odham are Mexican (9.7%, a difference of 0.080%), Spanish American Indian (9.6%, a difference of 1.3%), Native/Alaskan (9.9%, a difference of 2.3%), Yakama (9.5%, a difference of 2.6%), and Immigrants from Central America (10.0%, a difference of 2.9%).
| Demographics | Rating | Rank | Master's Degree |
| Pueblo | 0.0 /100 | #331 | Tragic 10.3% |
| Immigrants | Azores | 0.0 /100 | #332 | Tragic 10.2% |
| Menominee | 0.0 /100 | #333 | Tragic 10.2% |
| Arapaho | 0.0 /100 | #334 | Tragic 10.0% |
| Immigrants | Central America | 0.0 /100 | #335 | Tragic 10.0% |
| Natives/Alaskans | 0.0 /100 | #336 | Tragic 9.9% |
| Mexicans | 0.0 /100 | #337 | Tragic 9.7% |
| Tohono O'odham | 0.0 /100 | #338 | Tragic 9.7% |
| Spanish American Indians | 0.0 /100 | #339 | Tragic 9.6% |
| Yakama | 0.0 /100 | #340 | Tragic 9.5% |
| Navajo | 0.0 /100 | #341 | Tragic 9.4% |
| Immigrants | Mexico | 0.0 /100 | #342 | Tragic 9.3% |
| Lumbee | 0.0 /100 | #343 | Tragic 9.3% |
| Pima | 0.0 /100 | #344 | Tragic 9.2% |
| Yuman | 0.0 /100 | #345 | Tragic 9.2% |