Spanish American vs Immigrants from Armenia 4th Grade
COMPARE
Spanish American
Immigrants from Armenia
4th Grade
4th Grade Comparison
Spanish Americans
Immigrants from Armenia
97.5%
4TH GRADE
39.3/ 100
METRIC RATING
182nd/ 347
METRIC RANK
95.8%
4TH GRADE
0.0/ 100
METRIC RATING
331st/ 347
METRIC RANK
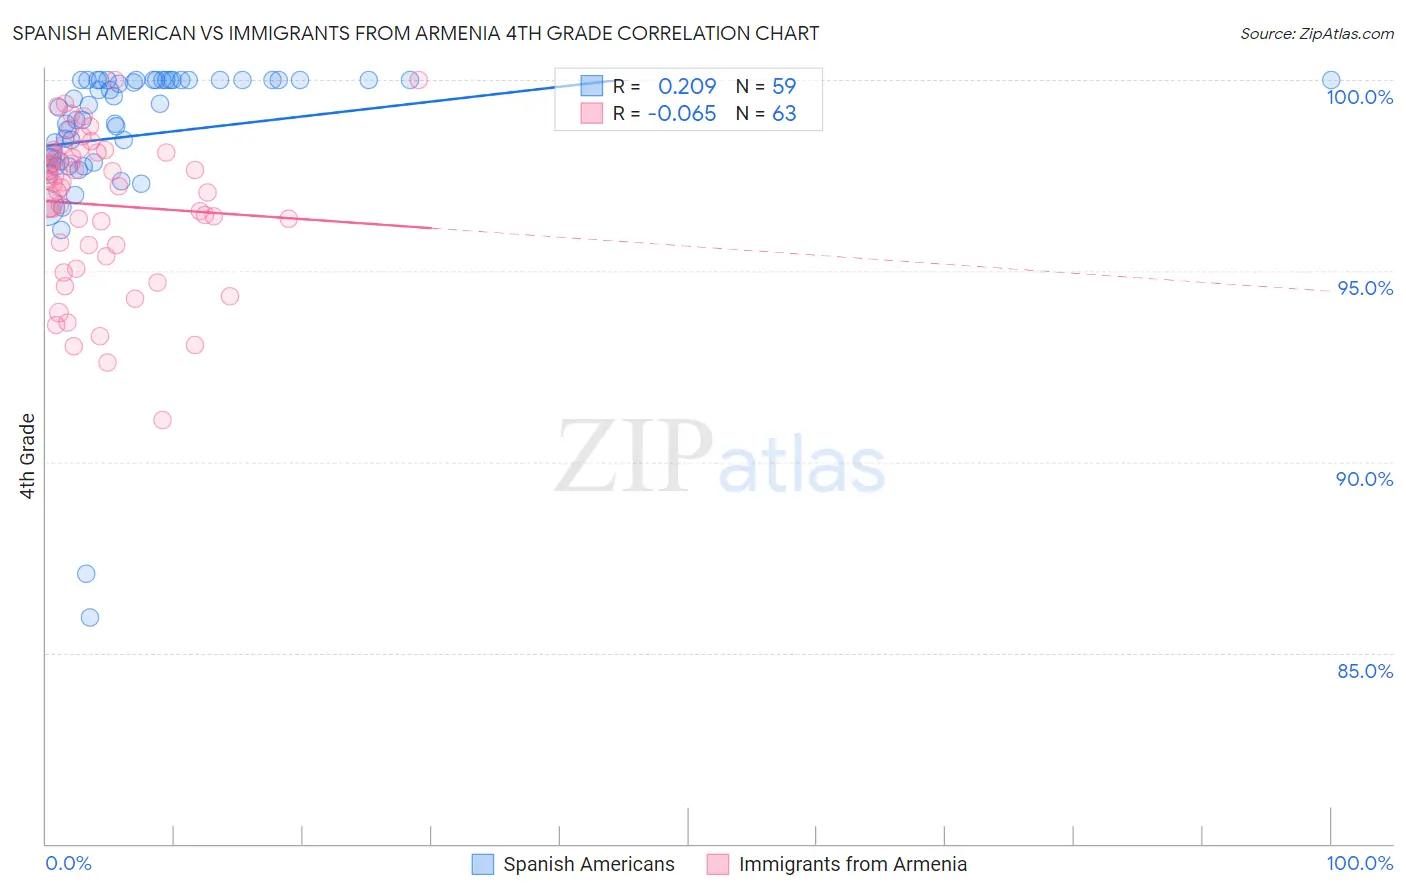
Spanish American vs Immigrants from Armenia 4th Grade Correlation Chart
The statistical analysis conducted on geographies consisting of 103,168,542 people shows a weak positive correlation between the proportion of Spanish Americans and percentage of population with at least 4th grade education in the United States with a correlation coefficient (R) of 0.209 and weighted average of 97.5%. Similarly, the statistical analysis conducted on geographies consisting of 97,657,339 people shows a slight negative correlation between the proportion of Immigrants from Armenia and percentage of population with at least 4th grade education in the United States with a correlation coefficient (R) of -0.065 and weighted average of 95.8%, a difference of 1.8%.
4th Grade Correlation Summary
| Measurement | Spanish American | Immigrants from Armenia |
| Minimum | 85.9% | 91.1% |
| Maximum | 100.0% | 100.0% |
| Range | 14.1% | 8.9% |
| Mean | 98.6% | 96.7% |
| Median | 99.3% | 97.2% |
| Interquartile 25% (IQ1) | 97.9% | 95.7% |
| Interquartile 75% (IQ3) | 100.0% | 98.1% |
| Interquartile Range (IQR) | 2.1% | 2.4% |
| Standard Deviation (Sample) | 2.5% | 1.9% |
| Standard Deviation (Population) | 2.5% | 1.9% |
Similar Demographics by 4th Grade
Demographics Similar to Spanish Americans by 4th Grade
In terms of 4th grade, the demographic groups most similar to Spanish Americans are Argentinean (97.5%, a difference of 0.0%), Immigrants from Venezuela (97.5%, a difference of 0.010%), Immigrants from Taiwan (97.5%, a difference of 0.010%), Pakistani (97.5%, a difference of 0.010%), and Immigrants from Kenya (97.5%, a difference of 0.010%).
| Demographics | Rating | Rank | 4th Grade |
| Immigrants | Micronesia | 49.6 /100 | #175 | Average 97.5% |
| Arabs | 48.7 /100 | #176 | Average 97.5% |
| Immigrants | Brazil | 46.1 /100 | #177 | Average 97.5% |
| Comanche | 45.3 /100 | #178 | Average 97.5% |
| Immigrants | Kazakhstan | 43.6 /100 | #179 | Average 97.5% |
| Immigrants | Venezuela | 42.7 /100 | #180 | Average 97.5% |
| Immigrants | Taiwan | 41.5 /100 | #181 | Average 97.5% |
| Spanish Americans | 39.3 /100 | #182 | Fair 97.5% |
| Argentineans | 39.0 /100 | #183 | Fair 97.5% |
| Pakistanis | 36.2 /100 | #184 | Fair 97.5% |
| Immigrants | Kenya | 35.8 /100 | #185 | Fair 97.5% |
| Dutch West Indians | 35.8 /100 | #186 | Fair 97.5% |
| Mongolians | 34.7 /100 | #187 | Fair 97.5% |
| Immigrants | Argentina | 34.6 /100 | #188 | Fair 97.5% |
| Panamanians | 31.9 /100 | #189 | Fair 97.4% |
Demographics Similar to Immigrants from Armenia by 4th Grade
In terms of 4th grade, the demographic groups most similar to Immigrants from Armenia are Immigrants from Honduras (95.8%, a difference of 0.010%), Immigrants from Cambodia (95.8%, a difference of 0.050%), Immigrants from Fiji (95.8%, a difference of 0.050%), Immigrants from Dominican Republic (95.7%, a difference of 0.060%), and Immigrants from Cabo Verde (95.7%, a difference of 0.060%).
| Demographics | Rating | Rank | 4th Grade |
| Immigrants | Belize | 0.0 /100 | #324 | Tragic 96.0% |
| Dominicans | 0.0 /100 | #325 | Tragic 96.0% |
| Hispanics or Latinos | 0.0 /100 | #326 | Tragic 96.0% |
| Hondurans | 0.0 /100 | #327 | Tragic 96.0% |
| Mexican American Indians | 0.0 /100 | #328 | Tragic 95.8% |
| Immigrants | Cambodia | 0.0 /100 | #329 | Tragic 95.8% |
| Immigrants | Fiji | 0.0 /100 | #330 | Tragic 95.8% |
| Immigrants | Armenia | 0.0 /100 | #331 | Tragic 95.8% |
| Immigrants | Honduras | 0.0 /100 | #332 | Tragic 95.8% |
| Immigrants | Dominican Republic | 0.0 /100 | #333 | Tragic 95.7% |
| Immigrants | Cabo Verde | 0.0 /100 | #334 | Tragic 95.7% |
| Immigrants | Latin America | 0.0 /100 | #335 | Tragic 95.7% |
| Mexicans | 0.0 /100 | #336 | Tragic 95.6% |
| Central Americans | 0.0 /100 | #337 | Tragic 95.5% |
| Nepalese | 0.0 /100 | #338 | Tragic 95.5% |