Spanish American vs Hungarian Bachelor's Degree
COMPARE
Spanish American
Hungarian
Bachelor's Degree
Bachelor's Degree Comparison
Spanish Americans
Hungarians
33.1%
BACHELOR'S DEGREE
0.6/ 100
METRIC RATING
257th/ 347
METRIC RANK
38.3%
BACHELOR'S DEGREE
62.1/ 100
METRIC RATING
164th/ 347
METRIC RANK
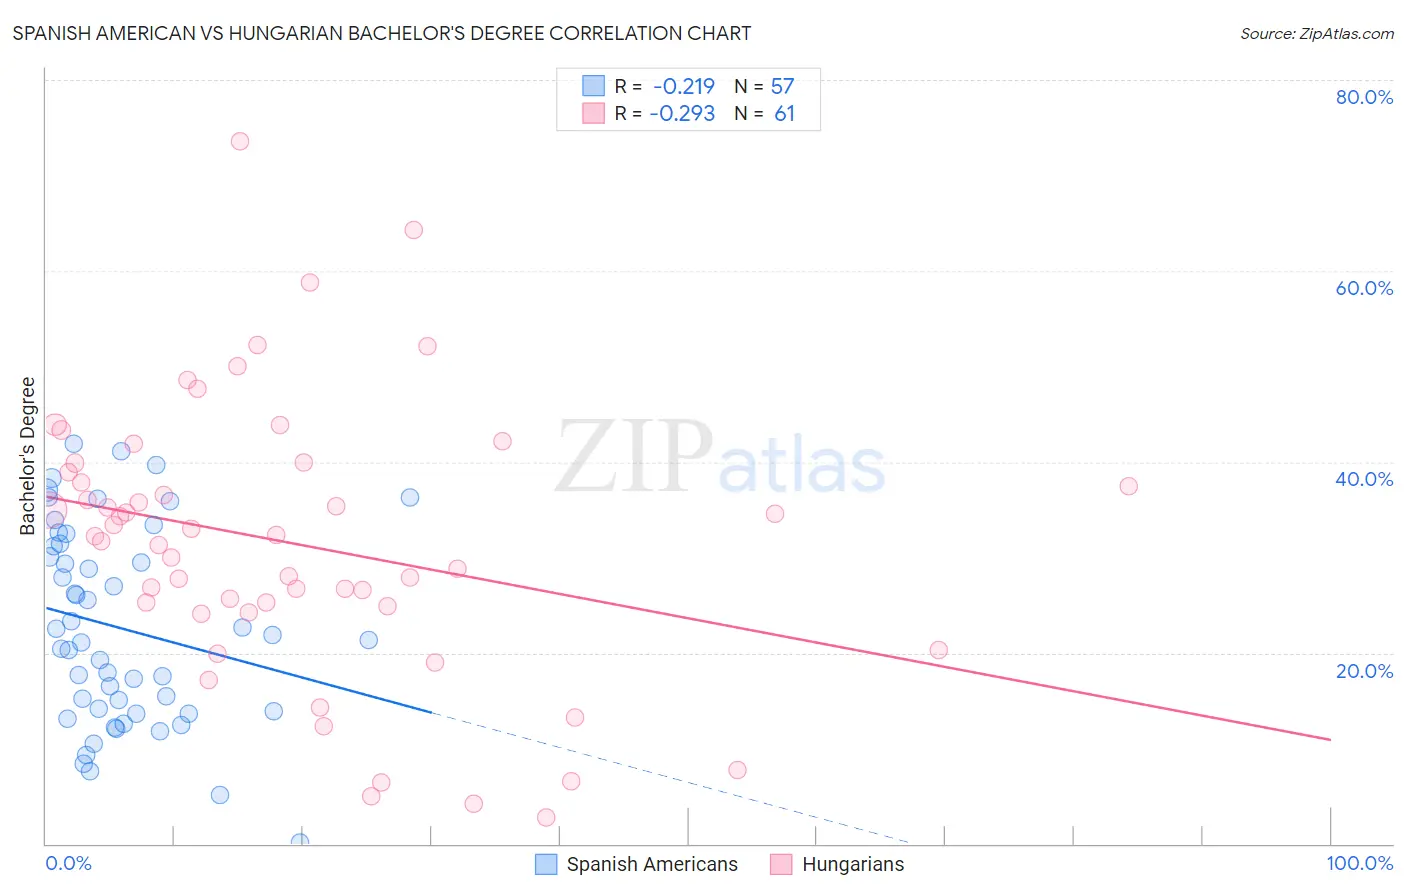
Spanish American vs Hungarian Bachelor's Degree Correlation Chart
The statistical analysis conducted on geographies consisting of 103,166,639 people shows a weak negative correlation between the proportion of Spanish Americans and percentage of population with at least bachelor's degree education in the United States with a correlation coefficient (R) of -0.219 and weighted average of 33.1%. Similarly, the statistical analysis conducted on geographies consisting of 486,195,655 people shows a weak negative correlation between the proportion of Hungarians and percentage of population with at least bachelor's degree education in the United States with a correlation coefficient (R) of -0.293 and weighted average of 38.3%, a difference of 15.7%.
Bachelor's Degree Correlation Summary
| Measurement | Spanish American | Hungarian |
| Minimum | 0.16% | 2.7% |
| Maximum | 41.9% | 73.6% |
| Range | 41.8% | 70.9% |
| Mean | 22.5% | 31.4% |
| Median | 21.3% | 32.2% |
| Interquartile 25% (IQ1) | 13.8% | 24.5% |
| Interquartile 75% (IQ3) | 31.3% | 39.4% |
| Interquartile Range (IQR) | 17.5% | 14.9% |
| Standard Deviation (Sample) | 10.2% | 14.5% |
| Standard Deviation (Population) | 10.2% | 14.3% |
Similar Demographics by Bachelor's Degree
Demographics Similar to Spanish Americans by Bachelor's Degree
In terms of bachelor's degree, the demographic groups most similar to Spanish Americans are French American Indian (33.1%, a difference of 0.040%), Osage (33.0%, a difference of 0.090%), Nicaraguan (33.1%, a difference of 0.22%), Iroquois (33.2%, a difference of 0.41%), and Native Hawaiian (33.2%, a difference of 0.43%).
| Demographics | Rating | Rank | Bachelor's Degree |
| Indonesians | 0.9 /100 | #250 | Tragic 33.5% |
| Japanese | 0.7 /100 | #251 | Tragic 33.3% |
| Immigrants | Bahamas | 0.7 /100 | #252 | Tragic 33.3% |
| U.S. Virgin Islanders | 0.7 /100 | #253 | Tragic 33.2% |
| Native Hawaiians | 0.7 /100 | #254 | Tragic 33.2% |
| Iroquois | 0.7 /100 | #255 | Tragic 33.2% |
| Nicaraguans | 0.6 /100 | #256 | Tragic 33.1% |
| Spanish Americans | 0.6 /100 | #257 | Tragic 33.1% |
| French American Indians | 0.6 /100 | #258 | Tragic 33.1% |
| Osage | 0.5 /100 | #259 | Tragic 33.0% |
| Malaysians | 0.5 /100 | #260 | Tragic 32.9% |
| Africans | 0.5 /100 | #261 | Tragic 32.9% |
| Immigrants | Jamaica | 0.5 /100 | #262 | Tragic 32.9% |
| Belizeans | 0.4 /100 | #263 | Tragic 32.8% |
| Central American Indians | 0.3 /100 | #264 | Tragic 32.5% |
Demographics Similar to Hungarians by Bachelor's Degree
In terms of bachelor's degree, the demographic groups most similar to Hungarians are Peruvian (38.3%, a difference of 0.14%), Sri Lankan (38.2%, a difference of 0.30%), Colombian (38.4%, a difference of 0.31%), Somali (38.1%, a difference of 0.35%), and Uruguayan (38.4%, a difference of 0.38%).
| Demographics | Rating | Rank | Bachelor's Degree |
| Immigrants | South America | 70.1 /100 | #157 | Good 38.6% |
| Immigrants | Germany | 69.6 /100 | #158 | Good 38.6% |
| Chinese | 66.6 /100 | #159 | Good 38.5% |
| Vietnamese | 66.6 /100 | #160 | Good 38.5% |
| Uruguayans | 65.8 /100 | #161 | Good 38.4% |
| Colombians | 65.0 /100 | #162 | Good 38.4% |
| Peruvians | 63.4 /100 | #163 | Good 38.3% |
| Hungarians | 62.1 /100 | #164 | Good 38.3% |
| Sri Lankans | 59.1 /100 | #165 | Average 38.2% |
| Somalis | 58.6 /100 | #166 | Average 38.1% |
| Scottish | 56.6 /100 | #167 | Average 38.1% |
| Danes | 56.2 /100 | #168 | Average 38.1% |
| Ghanaians | 55.3 /100 | #169 | Average 38.0% |
| Czechs | 54.4 /100 | #170 | Average 38.0% |
| Bermudans | 54.2 /100 | #171 | Average 38.0% |