Spanish American Indian vs Potawatomi Bachelor's Degree
COMPARE
Spanish American Indian
Potawatomi
Bachelor's Degree
Bachelor's Degree Comparison
Spanish American Indians
Potawatomi
27.5%
BACHELOR'S DEGREE
0.0/ 100
METRIC RATING
330th/ 347
METRIC RANK
31.9%
BACHELOR'S DEGREE
0.2/ 100
METRIC RATING
274th/ 347
METRIC RANK
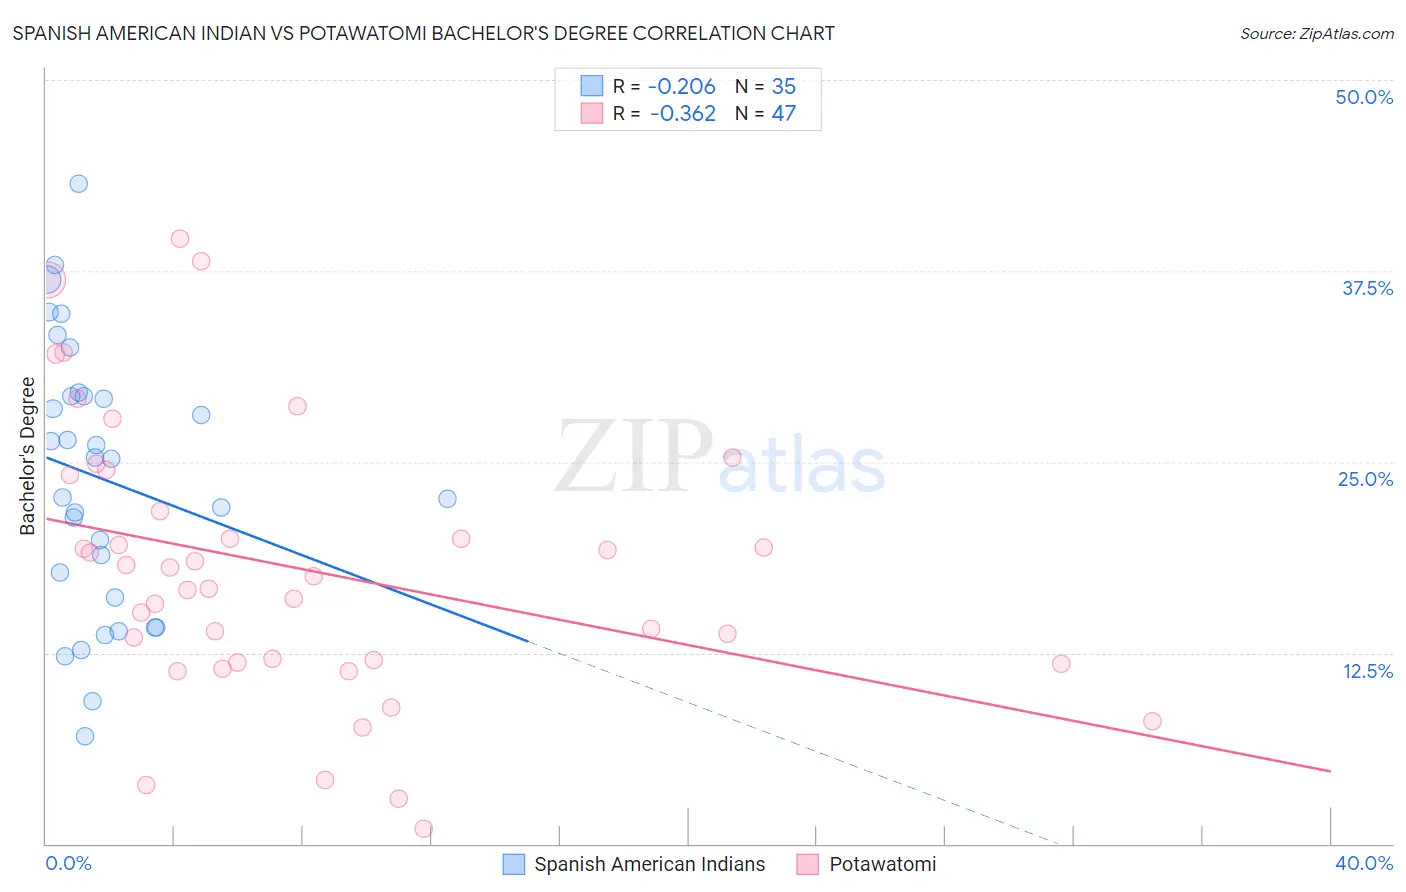
Spanish American Indian vs Potawatomi Bachelor's Degree Correlation Chart
The statistical analysis conducted on geographies consisting of 73,150,359 people shows a weak negative correlation between the proportion of Spanish American Indians and percentage of population with at least bachelor's degree education in the United States with a correlation coefficient (R) of -0.206 and weighted average of 27.5%. Similarly, the statistical analysis conducted on geographies consisting of 117,773,137 people shows a mild negative correlation between the proportion of Potawatomi and percentage of population with at least bachelor's degree education in the United States with a correlation coefficient (R) of -0.362 and weighted average of 31.9%, a difference of 16.0%.
Bachelor's Degree Correlation Summary
| Measurement | Spanish American Indian | Potawatomi |
| Minimum | 7.0% | 0.98% |
| Maximum | 43.2% | 39.6% |
| Range | 36.2% | 38.6% |
| Mean | 23.9% | 18.0% |
| Median | 25.2% | 17.5% |
| Interquartile 25% (IQ1) | 16.1% | 11.9% |
| Interquartile 75% (IQ3) | 29.3% | 24.2% |
| Interquartile Range (IQR) | 13.3% | 12.3% |
| Standard Deviation (Sample) | 8.8% | 9.0% |
| Standard Deviation (Population) | 8.7% | 8.9% |
Similar Demographics by Bachelor's Degree
Demographics Similar to Spanish American Indians by Bachelor's Degree
In terms of bachelor's degree, the demographic groups most similar to Spanish American Indians are Immigrants from Central America (27.5%, a difference of 0.060%), Immigrants from the Azores (27.3%, a difference of 0.48%), Menominee (27.3%, a difference of 0.58%), Crow (27.7%, a difference of 1.1%), and Mexican (27.1%, a difference of 1.4%).
| Demographics | Rating | Rank | Bachelor's Degree |
| Fijians | 0.0 /100 | #323 | Tragic 28.7% |
| Dutch West Indians | 0.0 /100 | #324 | Tragic 28.5% |
| Pennsylvania Germans | 0.0 /100 | #325 | Tragic 28.4% |
| Apache | 0.0 /100 | #326 | Tragic 28.3% |
| Paiute | 0.0 /100 | #327 | Tragic 28.1% |
| Crow | 0.0 /100 | #328 | Tragic 27.7% |
| Immigrants | Central America | 0.0 /100 | #329 | Tragic 27.5% |
| Spanish American Indians | 0.0 /100 | #330 | Tragic 27.5% |
| Immigrants | Azores | 0.0 /100 | #331 | Tragic 27.3% |
| Menominee | 0.0 /100 | #332 | Tragic 27.3% |
| Mexicans | 0.0 /100 | #333 | Tragic 27.1% |
| Arapaho | 0.0 /100 | #334 | Tragic 26.6% |
| Natives/Alaskans | 0.0 /100 | #335 | Tragic 26.3% |
| Immigrants | Mexico | 0.0 /100 | #336 | Tragic 26.1% |
| Inupiat | 0.0 /100 | #337 | Tragic 25.8% |
Demographics Similar to Potawatomi by Bachelor's Degree
In terms of bachelor's degree, the demographic groups most similar to Potawatomi are American (31.9%, a difference of 0.020%), Samoan (31.8%, a difference of 0.13%), Comanche (31.9%, a difference of 0.14%), Central American (31.9%, a difference of 0.17%), and Salvadoran (31.8%, a difference of 0.17%).
| Demographics | Rating | Rank | Bachelor's Degree |
| Cubans | 0.3 /100 | #267 | Tragic 32.5% |
| Immigrants | Portugal | 0.2 /100 | #268 | Tragic 32.2% |
| Immigrants | Belize | 0.2 /100 | #269 | Tragic 32.1% |
| Immigrants | Nicaragua | 0.2 /100 | #270 | Tragic 31.9% |
| Central Americans | 0.2 /100 | #271 | Tragic 31.9% |
| Comanche | 0.2 /100 | #272 | Tragic 31.9% |
| Americans | 0.2 /100 | #273 | Tragic 31.9% |
| Potawatomi | 0.2 /100 | #274 | Tragic 31.9% |
| Samoans | 0.1 /100 | #275 | Tragic 31.8% |
| Salvadorans | 0.1 /100 | #276 | Tragic 31.8% |
| Dominicans | 0.1 /100 | #277 | Tragic 31.8% |
| Marshallese | 0.1 /100 | #278 | Tragic 31.7% |
| Hawaiians | 0.1 /100 | #279 | Tragic 31.6% |
| Immigrants | Laos | 0.1 /100 | #280 | Tragic 31.6% |
| Blackfeet | 0.1 /100 | #281 | Tragic 31.5% |