Spaniard vs Sri Lankan 7th Grade
COMPARE
Spaniard
Sri Lankan
7th Grade
7th Grade Comparison
Spaniards
Sri Lankans
96.1%
7TH GRADE
62.6/ 100
METRIC RATING
163rd/ 347
METRIC RANK
94.4%
7TH GRADE
0.0/ 100
METRIC RATING
303rd/ 347
METRIC RANK
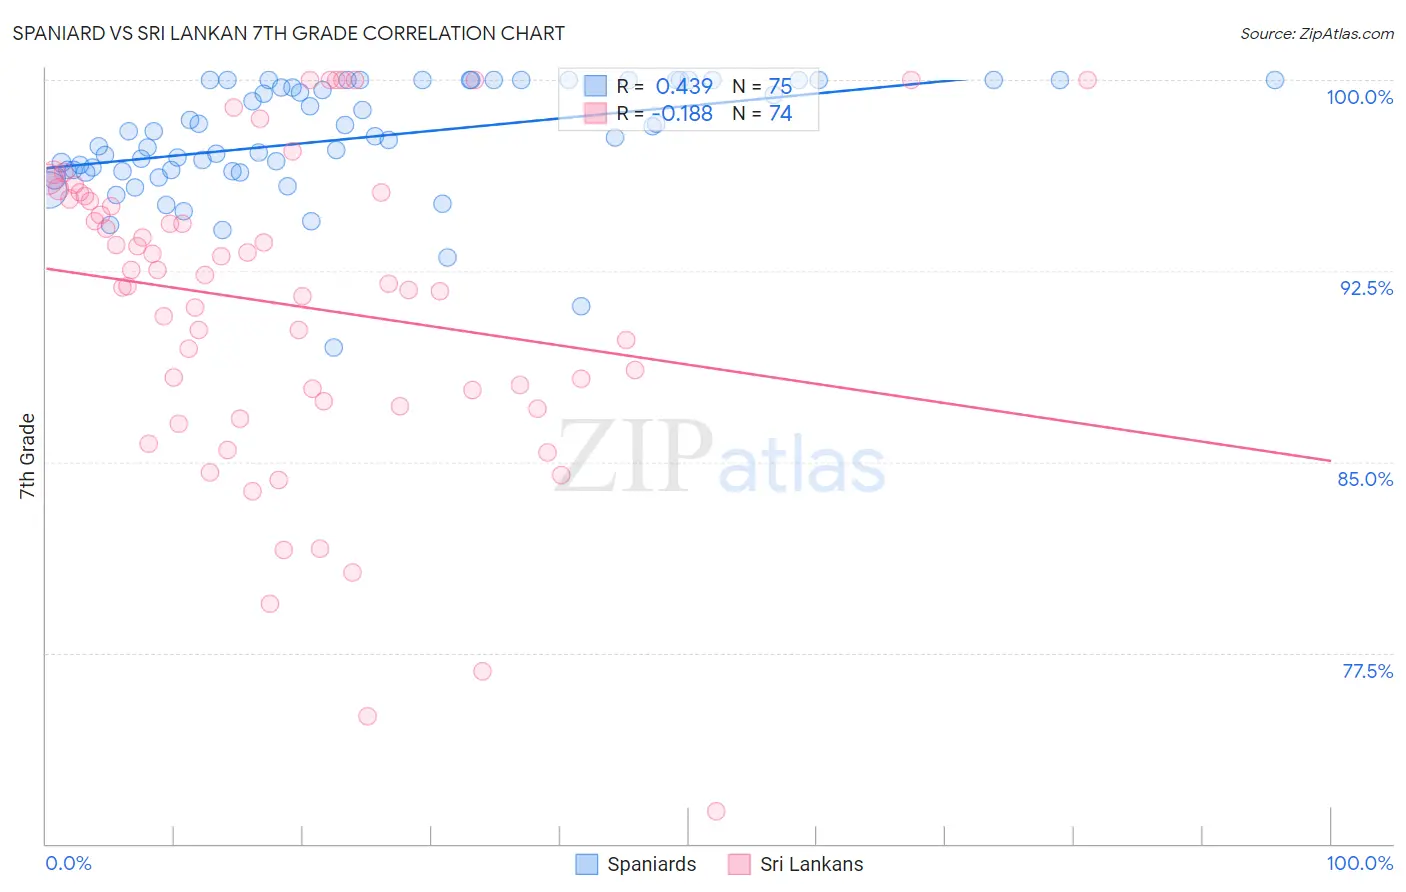
Spaniard vs Sri Lankan 7th Grade Correlation Chart
The statistical analysis conducted on geographies consisting of 443,544,503 people shows a moderate positive correlation between the proportion of Spaniards and percentage of population with at least 7th grade education in the United States with a correlation coefficient (R) of 0.439 and weighted average of 96.1%. Similarly, the statistical analysis conducted on geographies consisting of 440,593,938 people shows a poor negative correlation between the proportion of Sri Lankans and percentage of population with at least 7th grade education in the United States with a correlation coefficient (R) of -0.188 and weighted average of 94.4%, a difference of 1.8%.
7th Grade Correlation Summary
| Measurement | Spaniard | Sri Lankan |
| Minimum | 89.5% | 71.3% |
| Maximum | 100.0% | 100.0% |
| Range | 10.5% | 28.7% |
| Mean | 97.7% | 91.2% |
| Median | 97.8% | 92.2% |
| Interquartile 25% (IQ1) | 96.4% | 87.4% |
| Interquartile 75% (IQ3) | 100.0% | 95.5% |
| Interquartile Range (IQR) | 3.6% | 8.1% |
| Standard Deviation (Sample) | 2.2% | 6.2% |
| Standard Deviation (Population) | 2.2% | 6.2% |
Similar Demographics by 7th Grade
Demographics Similar to Spaniards by 7th Grade
In terms of 7th grade, the demographic groups most similar to Spaniards are Immigrants from Italy (96.1%, a difference of 0.0%), Pima (96.1%, a difference of 0.010%), Immigrants from Taiwan (96.1%, a difference of 0.010%), Immigrants from Kazakhstan (96.1%, a difference of 0.010%), and Bermudan (96.1%, a difference of 0.020%).
| Demographics | Rating | Rank | 7th Grade |
| Kenyans | 76.2 /100 | #156 | Good 96.2% |
| Ugandans | 75.5 /100 | #157 | Good 96.2% |
| Arabs | 68.6 /100 | #158 | Good 96.2% |
| Alsatians | 67.2 /100 | #159 | Good 96.1% |
| Immigrants | Kenya | 66.8 /100 | #160 | Good 96.1% |
| Bermudans | 66.3 /100 | #161 | Good 96.1% |
| Pima | 64.3 /100 | #162 | Good 96.1% |
| Spaniards | 62.6 /100 | #163 | Good 96.1% |
| Immigrants | Italy | 62.1 /100 | #164 | Good 96.1% |
| Immigrants | Taiwan | 61.5 /100 | #165 | Good 96.1% |
| Immigrants | Kazakhstan | 61.0 /100 | #166 | Good 96.1% |
| Immigrants | Sri Lanka | 59.9 /100 | #167 | Average 96.1% |
| Immigrants | Poland | 59.0 /100 | #168 | Average 96.1% |
| Ute | 55.8 /100 | #169 | Average 96.1% |
| Immigrants | Ukraine | 55.0 /100 | #170 | Average 96.1% |
Demographics Similar to Sri Lankans by 7th Grade
In terms of 7th grade, the demographic groups most similar to Sri Lankans are Immigrants from Haiti (94.3%, a difference of 0.030%), Guyanese (94.3%, a difference of 0.060%), Immigrants from Laos (94.5%, a difference of 0.080%), Immigrants from Dominica (94.5%, a difference of 0.090%), and Immigrants from Burma/Myanmar (94.5%, a difference of 0.12%).
| Demographics | Rating | Rank | 7th Grade |
| Cubans | 0.0 /100 | #296 | Tragic 94.6% |
| Immigrants | South Eastern Asia | 0.0 /100 | #297 | Tragic 94.5% |
| Indonesians | 0.0 /100 | #298 | Tragic 94.5% |
| Bangladeshis | 0.0 /100 | #299 | Tragic 94.5% |
| Immigrants | Burma/Myanmar | 0.0 /100 | #300 | Tragic 94.5% |
| Immigrants | Dominica | 0.0 /100 | #301 | Tragic 94.5% |
| Immigrants | Laos | 0.0 /100 | #302 | Tragic 94.5% |
| Sri Lankans | 0.0 /100 | #303 | Tragic 94.4% |
| Immigrants | Haiti | 0.0 /100 | #304 | Tragic 94.3% |
| Guyanese | 0.0 /100 | #305 | Tragic 94.3% |
| Immigrants | Guyana | 0.0 /100 | #306 | Tragic 94.2% |
| Immigrants | Portugal | 0.0 /100 | #307 | Tragic 94.2% |
| Cape Verdeans | 0.0 /100 | #308 | Tragic 94.1% |
| Ecuadorians | 0.0 /100 | #309 | Tragic 94.0% |
| Immigrants | Caribbean | 0.0 /100 | #310 | Tragic 94.0% |