Spaniard vs Colombian High School Diploma
COMPARE
Spaniard
Colombian
High School Diploma
High School Diploma Comparison
Spaniards
Colombians
89.1%
HIGH SCHOOL DIPLOMA
43.4/ 100
METRIC RATING
182nd/ 347
METRIC RANK
88.1%
HIGH SCHOOL DIPLOMA
3.8/ 100
METRIC RATING
231st/ 347
METRIC RANK
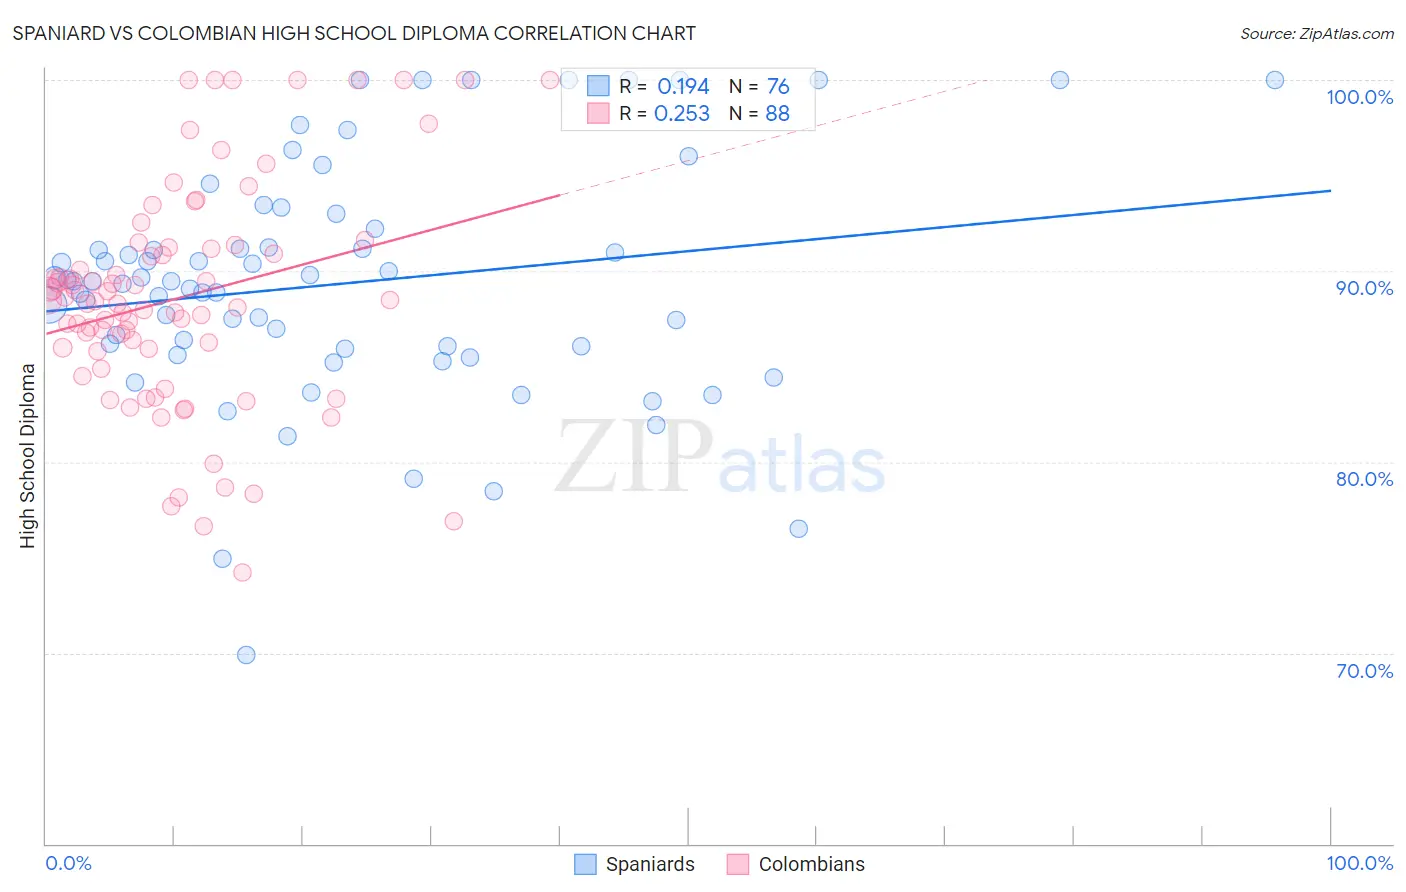
Spaniard vs Colombian High School Diploma Correlation Chart
The statistical analysis conducted on geographies consisting of 443,545,794 people shows a poor positive correlation between the proportion of Spaniards and percentage of population with at least high school diploma education in the United States with a correlation coefficient (R) of 0.194 and weighted average of 89.1%. Similarly, the statistical analysis conducted on geographies consisting of 419,701,311 people shows a weak positive correlation between the proportion of Colombians and percentage of population with at least high school diploma education in the United States with a correlation coefficient (R) of 0.253 and weighted average of 88.1%, a difference of 1.1%.
High School Diploma Correlation Summary
| Measurement | Spaniard | Colombian |
| Minimum | 69.9% | 74.2% |
| Maximum | 100.0% | 100.0% |
| Range | 30.1% | 25.8% |
| Mean | 89.3% | 88.6% |
| Median | 89.5% | 88.4% |
| Interquartile 25% (IQ1) | 86.0% | 85.9% |
| Interquartile 75% (IQ3) | 91.7% | 91.2% |
| Interquartile Range (IQR) | 5.7% | 5.3% |
| Standard Deviation (Sample) | 6.2% | 5.8% |
| Standard Deviation (Population) | 6.1% | 5.8% |
Similar Demographics by High School Diploma
Demographics Similar to Spaniards by High School Diploma
In terms of high school diploma, the demographic groups most similar to Spaniards are Venezuelan (89.1%, a difference of 0.0%), Potawatomi (89.0%, a difference of 0.010%), Bolivian (89.1%, a difference of 0.030%), American (89.1%, a difference of 0.060%), and Immigrants from Syria (89.0%, a difference of 0.060%).
| Demographics | Rating | Rank | High School Diploma |
| Immigrants | Western Asia | 49.0 /100 | #175 | Average 89.1% |
| Osage | 48.9 /100 | #176 | Average 89.1% |
| Sudanese | 48.5 /100 | #177 | Average 89.1% |
| Sierra Leoneans | 48.4 /100 | #178 | Average 89.1% |
| Americans | 47.2 /100 | #179 | Average 89.1% |
| Bolivians | 45.2 /100 | #180 | Average 89.1% |
| Venezuelans | 43.6 /100 | #181 | Average 89.1% |
| Spaniards | 43.4 /100 | #182 | Average 89.1% |
| Potawatomi | 42.5 /100 | #183 | Average 89.0% |
| Immigrants | Syria | 39.2 /100 | #184 | Fair 89.0% |
| Ethiopians | 37.0 /100 | #185 | Fair 89.0% |
| Immigrants | Eastern Africa | 35.8 /100 | #186 | Fair 88.9% |
| Guamanians/Chamorros | 35.5 /100 | #187 | Fair 88.9% |
| Immigrants | Sudan | 33.4 /100 | #188 | Fair 88.9% |
| Immigrants | Uganda | 32.6 /100 | #189 | Fair 88.9% |
Demographics Similar to Colombians by High School Diploma
In terms of high school diploma, the demographic groups most similar to Colombians are Blackfeet (88.1%, a difference of 0.040%), Immigrants from Middle Africa (88.0%, a difference of 0.050%), Immigrants from Panama (88.0%, a difference of 0.080%), Immigrants from Thailand (88.0%, a difference of 0.090%), and Immigrants from Bahamas (88.0%, a difference of 0.10%).
| Demographics | Rating | Rank | High School Diploma |
| Shoshone | 7.0 /100 | #224 | Tragic 88.3% |
| Creek | 6.9 /100 | #225 | Tragic 88.3% |
| Uruguayans | 5.6 /100 | #226 | Tragic 88.2% |
| Immigrants | Liberia | 5.5 /100 | #227 | Tragic 88.2% |
| Kiowa | 5.3 /100 | #228 | Tragic 88.2% |
| Nigerians | 5.2 /100 | #229 | Tragic 88.2% |
| Blackfeet | 4.2 /100 | #230 | Tragic 88.1% |
| Colombians | 3.8 /100 | #231 | Tragic 88.1% |
| Immigrants | Middle Africa | 3.4 /100 | #232 | Tragic 88.0% |
| Immigrants | Panama | 3.1 /100 | #233 | Tragic 88.0% |
| Immigrants | Thailand | 3.1 /100 | #234 | Tragic 88.0% |
| Immigrants | Bahamas | 2.9 /100 | #235 | Tragic 88.0% |
| Sub-Saharan Africans | 2.8 /100 | #236 | Tragic 87.9% |
| Taiwanese | 2.8 /100 | #237 | Tragic 87.9% |
| Sioux | 2.7 /100 | #238 | Tragic 87.9% |