Soviet Union vs Immigrants from Bosnia and Herzegovina Master's Degree
COMPARE
Soviet Union
Immigrants from Bosnia and Herzegovina
Master's Degree
Master's Degree Comparison
Soviet Union
Immigrants from Bosnia and Herzegovina
20.5%
MASTER'S DEGREE
100.0/ 100
METRIC RATING
18th/ 347
METRIC RANK
14.3%
MASTER'S DEGREE
22.0/ 100
METRIC RATING
207th/ 347
METRIC RANK
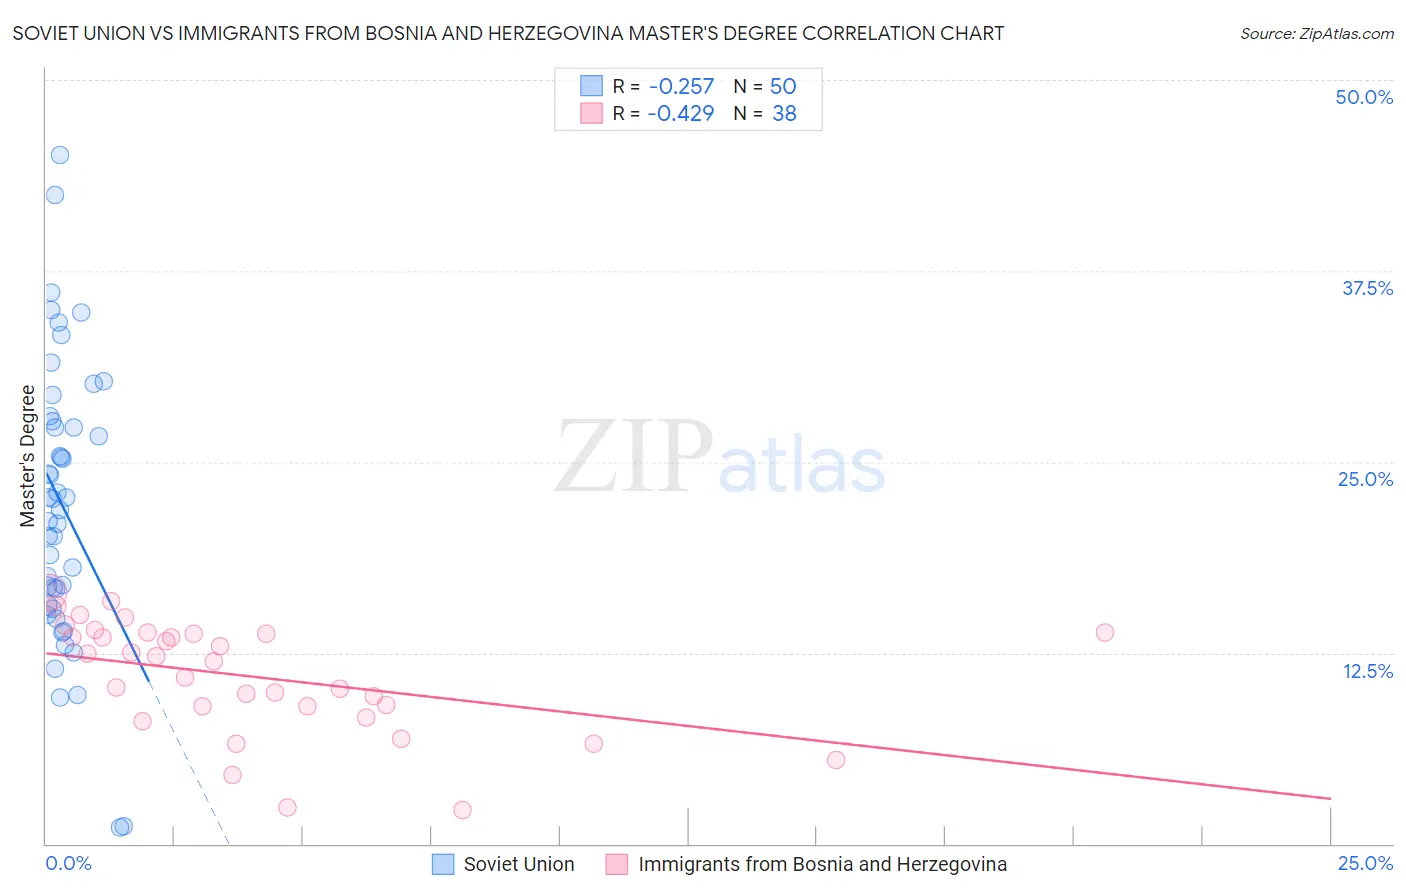
Soviet Union vs Immigrants from Bosnia and Herzegovina Master's Degree Correlation Chart
The statistical analysis conducted on geographies consisting of 43,514,626 people shows a weak negative correlation between the proportion of Soviet Union and percentage of population with at least master's degree education in the United States with a correlation coefficient (R) of -0.257 and weighted average of 20.5%. Similarly, the statistical analysis conducted on geographies consisting of 156,790,700 people shows a moderate negative correlation between the proportion of Immigrants from Bosnia and Herzegovina and percentage of population with at least master's degree education in the United States with a correlation coefficient (R) of -0.429 and weighted average of 14.3%, a difference of 43.4%.
Master's Degree Correlation Summary
| Measurement | Soviet Union | Immigrants from Bosnia and Herzegovina |
| Minimum | 1.0% | 2.2% |
| Maximum | 45.1% | 16.4% |
| Range | 44.1% | 14.3% |
| Mean | 22.1% | 10.9% |
| Median | 22.2% | 12.1% |
| Interquartile 25% (IQ1) | 15.6% | 9.0% |
| Interquartile 75% (IQ3) | 27.6% | 13.8% |
| Interquartile Range (IQR) | 12.0% | 4.8% |
| Standard Deviation (Sample) | 9.2% | 3.7% |
| Standard Deviation (Population) | 9.1% | 3.6% |
Similar Demographics by Master's Degree
Demographics Similar to Soviet Union by Master's Degree
In terms of master's degree, the demographic groups most similar to Soviet Union are Immigrants from Hong Kong (20.5%, a difference of 0.35%), Indian (Asian) (20.5%, a difference of 0.37%), Immigrants from Ireland (20.4%, a difference of 0.48%), Israeli (20.3%, a difference of 0.90%), and Immigrants from South Central Asia (20.7%, a difference of 0.92%).
| Demographics | Rating | Rank | Master's Degree |
| Immigrants | China | 100.0 /100 | #11 | Exceptional 21.2% |
| Eastern Europeans | 100.0 /100 | #12 | Exceptional 21.1% |
| Immigrants | Australia | 100.0 /100 | #13 | Exceptional 20.9% |
| Immigrants | Switzerland | 100.0 /100 | #14 | Exceptional 20.9% |
| Immigrants | Eastern Asia | 100.0 /100 | #15 | Exceptional 20.8% |
| Immigrants | Belgium | 100.0 /100 | #16 | Exceptional 20.8% |
| Immigrants | South Central Asia | 100.0 /100 | #17 | Exceptional 20.7% |
| Soviet Union | 100.0 /100 | #18 | Exceptional 20.5% |
| Immigrants | Hong Kong | 100.0 /100 | #19 | Exceptional 20.5% |
| Indians (Asian) | 100.0 /100 | #20 | Exceptional 20.5% |
| Immigrants | Ireland | 100.0 /100 | #21 | Exceptional 20.4% |
| Israelis | 100.0 /100 | #22 | Exceptional 20.3% |
| Immigrants | France | 100.0 /100 | #23 | Exceptional 20.3% |
| Immigrants | Sweden | 100.0 /100 | #24 | Exceptional 20.3% |
| Immigrants | Japan | 100.0 /100 | #25 | Exceptional 20.0% |
Demographics Similar to Immigrants from Bosnia and Herzegovina by Master's Degree
In terms of master's degree, the demographic groups most similar to Immigrants from Bosnia and Herzegovina are Scandinavian (14.4%, a difference of 0.25%), Trinidadian and Tobagonian (14.4%, a difference of 0.29%), Immigrants from Barbados (14.3%, a difference of 0.30%), French (14.4%, a difference of 0.32%), and Immigrants from Panama (14.3%, a difference of 0.39%).
| Demographics | Rating | Rank | Master's Degree |
| Panamanians | 25.1 /100 | #200 | Fair 14.4% |
| Scotch-Irish | 25.0 /100 | #201 | Fair 14.4% |
| Immigrants | Western Africa | 24.9 /100 | #202 | Fair 14.4% |
| Yugoslavians | 24.3 /100 | #203 | Fair 14.4% |
| French | 23.7 /100 | #204 | Fair 14.4% |
| Trinidadians and Tobagonians | 23.5 /100 | #205 | Fair 14.4% |
| Scandinavians | 23.3 /100 | #206 | Fair 14.4% |
| Immigrants | Bosnia and Herzegovina | 22.0 /100 | #207 | Fair 14.3% |
| Immigrants | Barbados | 20.5 /100 | #208 | Fair 14.3% |
| Immigrants | Panama | 20.0 /100 | #209 | Fair 14.3% |
| Sub-Saharan Africans | 19.4 /100 | #210 | Poor 14.2% |
| Somalis | 18.0 /100 | #211 | Poor 14.2% |
| Spanish | 17.8 /100 | #212 | Poor 14.2% |
| Immigrants | Thailand | 17.0 /100 | #213 | Poor 14.2% |
| Finns | 16.9 /100 | #214 | Poor 14.2% |