Soviet Union vs Argentinean 4th Grade
COMPARE
Soviet Union
Argentinean
4th Grade
4th Grade Comparison
Soviet Union
Argentineans
97.6%
4TH GRADE
77.8/ 100
METRIC RATING
149th/ 347
METRIC RANK
97.5%
4TH GRADE
39.0/ 100
METRIC RATING
183rd/ 347
METRIC RANK
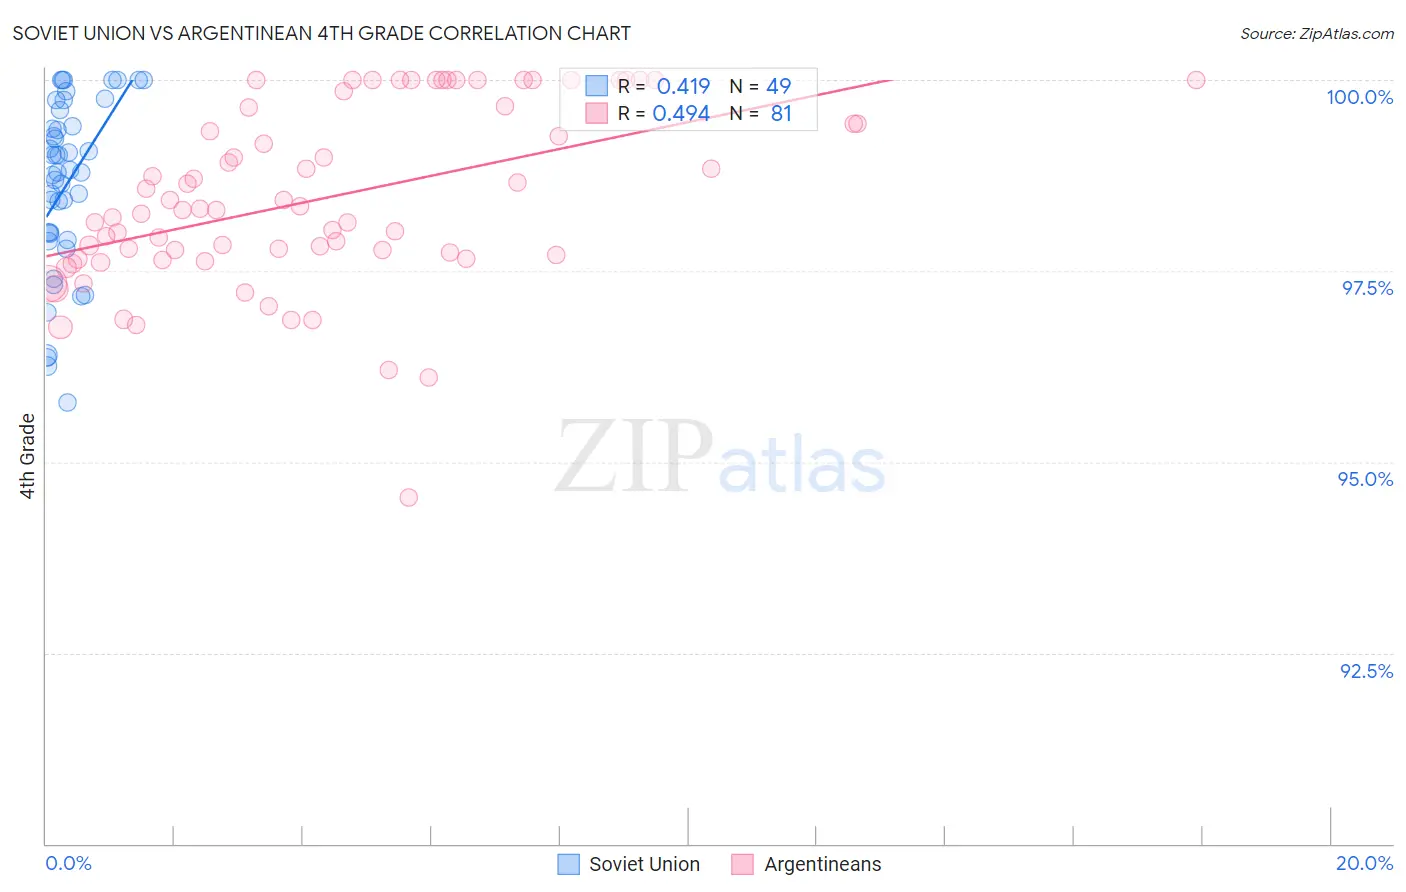
Soviet Union vs Argentinean 4th Grade Correlation Chart
The statistical analysis conducted on geographies consisting of 43,454,395 people shows a moderate positive correlation between the proportion of Soviet Union and percentage of population with at least 4th grade education in the United States with a correlation coefficient (R) of 0.419 and weighted average of 97.6%. Similarly, the statistical analysis conducted on geographies consisting of 297,143,222 people shows a moderate positive correlation between the proportion of Argentineans and percentage of population with at least 4th grade education in the United States with a correlation coefficient (R) of 0.494 and weighted average of 97.5%, a difference of 0.16%.
4th Grade Correlation Summary
| Measurement | Soviet Union | Argentinean |
| Minimum | 95.8% | 94.5% |
| Maximum | 100.0% | 100.0% |
| Range | 4.2% | 5.5% |
| Mean | 98.6% | 98.5% |
| Median | 98.8% | 98.3% |
| Interquartile 25% (IQ1) | 97.9% | 97.7% |
| Interquartile 75% (IQ3) | 99.5% | 99.7% |
| Interquartile Range (IQR) | 1.6% | 2.0% |
| Standard Deviation (Sample) | 1.1% | 1.2% |
| Standard Deviation (Population) | 1.1% | 1.2% |
Similar Demographics by 4th Grade
Demographics Similar to Soviet Union by 4th Grade
In terms of 4th grade, the demographic groups most similar to Soviet Union are Immigrants from Israel (97.6%, a difference of 0.0%), Alsatian (97.6%, a difference of 0.0%), Immigrants from South Central Asia (97.6%, a difference of 0.010%), Jordanian (97.7%, a difference of 0.020%), and Ute (97.7%, a difference of 0.020%).
| Demographics | Rating | Rank | 4th Grade |
| Immigrants | North Macedonia | 83.3 /100 | #142 | Excellent 97.7% |
| Burmese | 82.8 /100 | #143 | Excellent 97.7% |
| Spaniards | 82.7 /100 | #144 | Excellent 97.7% |
| Immigrants | Moldova | 82.4 /100 | #145 | Excellent 97.7% |
| Jordanians | 81.3 /100 | #146 | Excellent 97.7% |
| Ute | 80.6 /100 | #147 | Excellent 97.7% |
| Hopi | 80.6 /100 | #148 | Excellent 97.7% |
| Soviet Union | 77.8 /100 | #149 | Good 97.6% |
| Immigrants | Israel | 77.7 /100 | #150 | Good 97.6% |
| Alsatians | 77.2 /100 | #151 | Good 97.6% |
| Immigrants | South Central Asia | 76.2 /100 | #152 | Good 97.6% |
| Immigrants | Eastern Europe | 71.3 /100 | #153 | Good 97.6% |
| Immigrants | Russia | 67.0 /100 | #154 | Good 97.6% |
| Albanians | 67.0 /100 | #155 | Good 97.6% |
| Immigrants | Jordan | 66.9 /100 | #156 | Good 97.6% |
Demographics Similar to Argentineans by 4th Grade
In terms of 4th grade, the demographic groups most similar to Argentineans are Spanish American (97.5%, a difference of 0.0%), Immigrants from Venezuela (97.5%, a difference of 0.010%), Immigrants from Taiwan (97.5%, a difference of 0.010%), Pakistani (97.5%, a difference of 0.010%), and Immigrants from Kenya (97.5%, a difference of 0.010%).
| Demographics | Rating | Rank | 4th Grade |
| Arabs | 48.7 /100 | #176 | Average 97.5% |
| Immigrants | Brazil | 46.1 /100 | #177 | Average 97.5% |
| Comanche | 45.3 /100 | #178 | Average 97.5% |
| Immigrants | Kazakhstan | 43.6 /100 | #179 | Average 97.5% |
| Immigrants | Venezuela | 42.7 /100 | #180 | Average 97.5% |
| Immigrants | Taiwan | 41.5 /100 | #181 | Average 97.5% |
| Spanish Americans | 39.3 /100 | #182 | Fair 97.5% |
| Argentineans | 39.0 /100 | #183 | Fair 97.5% |
| Pakistanis | 36.2 /100 | #184 | Fair 97.5% |
| Immigrants | Kenya | 35.8 /100 | #185 | Fair 97.5% |
| Dutch West Indians | 35.8 /100 | #186 | Fair 97.5% |
| Mongolians | 34.7 /100 | #187 | Fair 97.5% |
| Immigrants | Argentina | 34.6 /100 | #188 | Fair 97.5% |
| Panamanians | 31.9 /100 | #189 | Fair 97.4% |
| Blacks/African Americans | 31.1 /100 | #190 | Fair 97.4% |