South American vs Tlingit-Haida 8th Grade
COMPARE
South American
Tlingit-Haida
8th Grade
8th Grade Comparison
South Americans
Tlingit-Haida
94.9%
8TH GRADE
0.4/ 100
METRIC RATING
264th/ 347
METRIC RANK
97.3%
8TH GRADE
100.0/ 100
METRIC RATING
16th/ 347
METRIC RANK
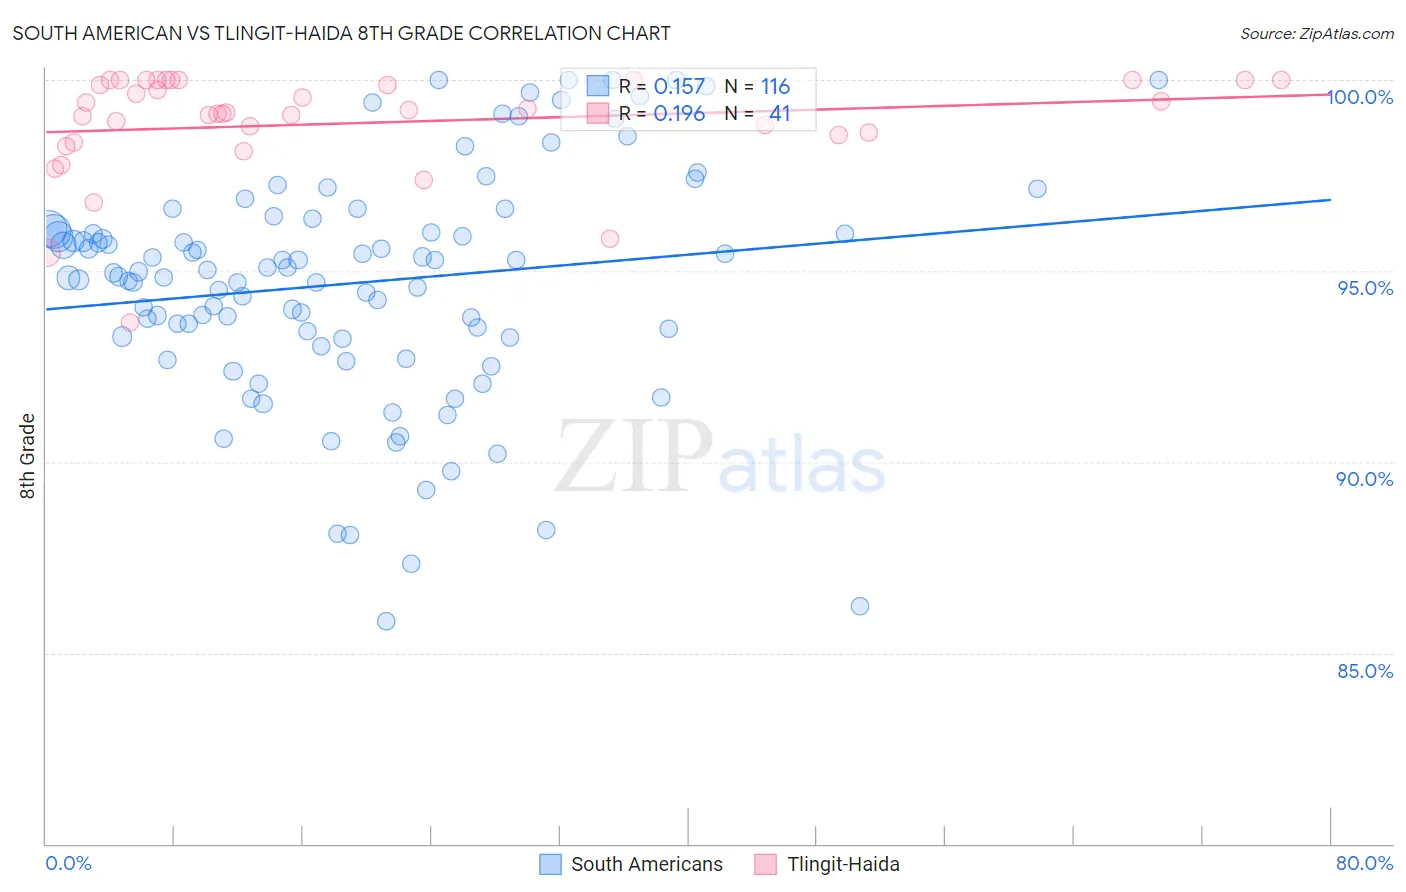
South American vs Tlingit-Haida 8th Grade Correlation Chart
The statistical analysis conducted on geographies consisting of 494,065,697 people shows a poor positive correlation between the proportion of South Americans and percentage of population with at least 8th grade education in the United States with a correlation coefficient (R) of 0.157 and weighted average of 94.9%. Similarly, the statistical analysis conducted on geographies consisting of 60,865,648 people shows a poor positive correlation between the proportion of Tlingit-Haida and percentage of population with at least 8th grade education in the United States with a correlation coefficient (R) of 0.196 and weighted average of 97.3%, a difference of 2.6%.
8th Grade Correlation Summary
| Measurement | South American | Tlingit-Haida |
| Minimum | 85.8% | 93.7% |
| Maximum | 100.0% | 100.0% |
| Range | 14.2% | 6.3% |
| Mean | 94.7% | 98.9% |
| Median | 95.0% | 99.1% |
| Interquartile 25% (IQ1) | 93.3% | 98.5% |
| Interquartile 75% (IQ3) | 96.1% | 100.0% |
| Interquartile Range (IQR) | 2.8% | 1.5% |
| Standard Deviation (Sample) | 3.0% | 1.4% |
| Standard Deviation (Population) | 3.0% | 1.4% |
Similar Demographics by 8th Grade
Demographics Similar to South Americans by 8th Grade
In terms of 8th grade, the demographic groups most similar to South Americans are Immigrants from Hong Kong (94.9%, a difference of 0.0%), Yuman (94.9%, a difference of 0.0%), Immigrants from Nigeria (94.9%, a difference of 0.010%), Immigrants from Costa Rica (94.9%, a difference of 0.030%), and West Indian (94.8%, a difference of 0.050%).
| Demographics | Rating | Rank | 8th Grade |
| Afghans | 0.6 /100 | #257 | Tragic 94.9% |
| Immigrants | Congo | 0.6 /100 | #258 | Tragic 94.9% |
| Ghanaians | 0.6 /100 | #259 | Tragic 94.9% |
| Immigrants | Jamaica | 0.6 /100 | #260 | Tragic 94.9% |
| Immigrants | Costa Rica | 0.5 /100 | #261 | Tragic 94.9% |
| Immigrants | Nigeria | 0.4 /100 | #262 | Tragic 94.9% |
| Immigrants | Hong Kong | 0.4 /100 | #263 | Tragic 94.9% |
| South Americans | 0.4 /100 | #264 | Tragic 94.9% |
| Yuman | 0.4 /100 | #265 | Tragic 94.9% |
| West Indians | 0.3 /100 | #266 | Tragic 94.8% |
| Immigrants | Ghana | 0.3 /100 | #267 | Tragic 94.8% |
| Immigrants | Uruguay | 0.3 /100 | #268 | Tragic 94.8% |
| Immigrants | Thailand | 0.2 /100 | #269 | Tragic 94.8% |
| Immigrants | Uzbekistan | 0.2 /100 | #270 | Tragic 94.8% |
| Immigrants | Afghanistan | 0.2 /100 | #271 | Tragic 94.8% |
Demographics Similar to Tlingit-Haida by 8th Grade
In terms of 8th grade, the demographic groups most similar to Tlingit-Haida are Irish (97.3%, a difference of 0.010%), Lithuanian (97.3%, a difference of 0.020%), Pennsylvania German (97.3%, a difference of 0.030%), Scottish (97.3%, a difference of 0.030%), and Alaskan Athabascan (97.3%, a difference of 0.040%).
| Demographics | Rating | Rank | 8th Grade |
| Germans | 100.0 /100 | #9 | Exceptional 97.5% |
| Slovenes | 100.0 /100 | #10 | Exceptional 97.5% |
| Poles | 100.0 /100 | #11 | Exceptional 97.4% |
| Swedes | 100.0 /100 | #12 | Exceptional 97.4% |
| Alaskan Athabascans | 100.0 /100 | #13 | Exceptional 97.3% |
| English | 100.0 /100 | #14 | Exceptional 97.3% |
| Pennsylvania Germans | 100.0 /100 | #15 | Exceptional 97.3% |
| Tlingit-Haida | 100.0 /100 | #16 | Exceptional 97.3% |
| Irish | 100.0 /100 | #17 | Exceptional 97.3% |
| Lithuanians | 100.0 /100 | #18 | Exceptional 97.3% |
| Scottish | 100.0 /100 | #19 | Exceptional 97.3% |
| Croatians | 100.0 /100 | #20 | Exceptional 97.2% |
| Danes | 100.0 /100 | #21 | Exceptional 97.2% |
| Welsh | 100.0 /100 | #22 | Exceptional 97.2% |
| French Canadians | 100.0 /100 | #23 | Exceptional 97.2% |