South American vs Sudanese Associate's Degree
COMPARE
South American
Sudanese
Associate's Degree
Associate's Degree Comparison
South Americans
Sudanese
47.1%
ASSOCIATE'S DEGREE
70.5/ 100
METRIC RATING
156th/ 347
METRIC RANK
47.1%
ASSOCIATE'S DEGREE
70.3/ 100
METRIC RATING
157th/ 347
METRIC RANK
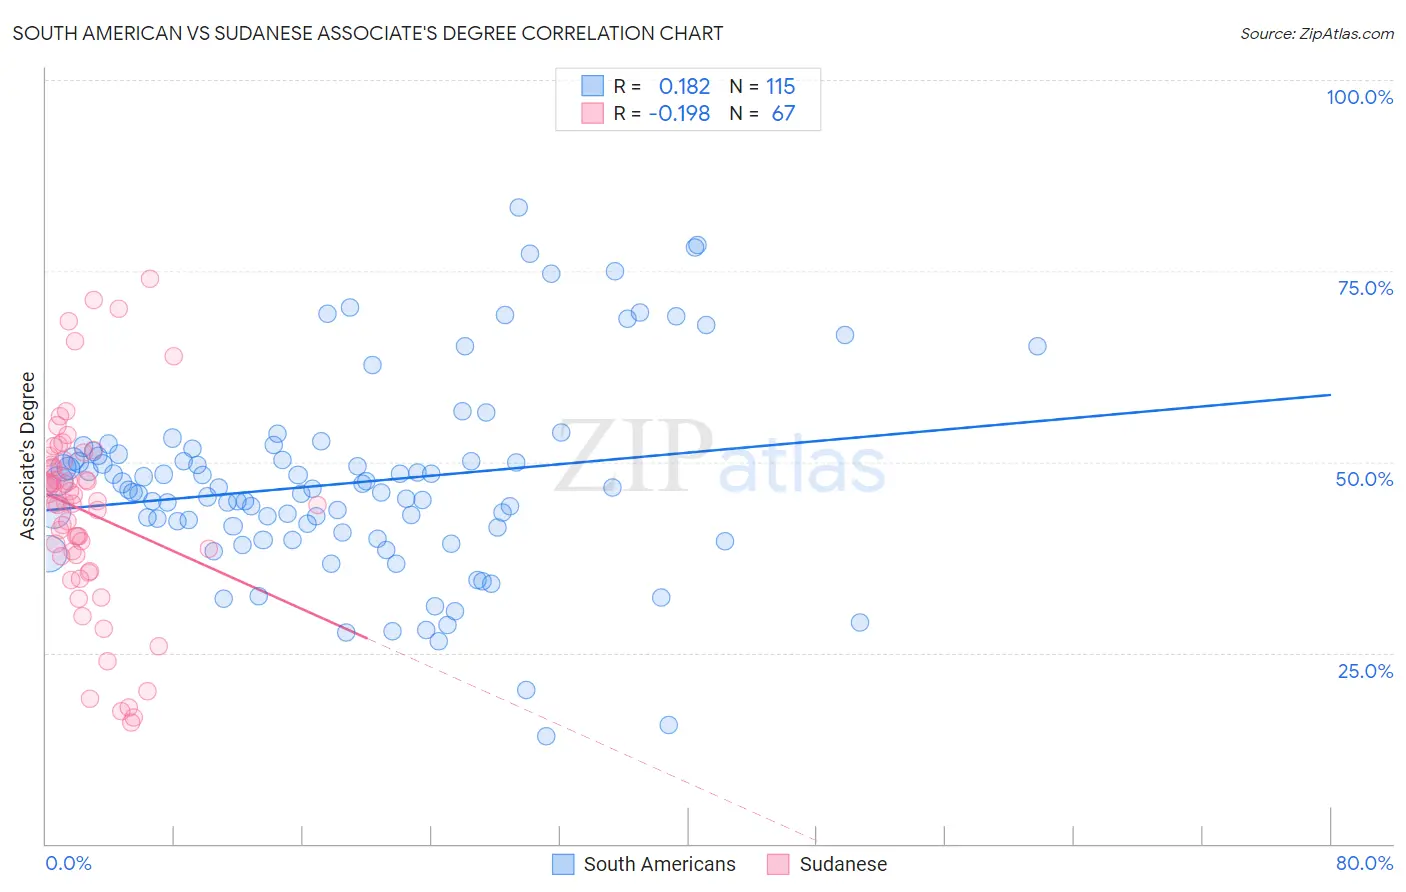
South American vs Sudanese Associate's Degree Correlation Chart
The statistical analysis conducted on geographies consisting of 494,120,152 people shows a poor positive correlation between the proportion of South Americans and percentage of population with at least associate's degree education in the United States with a correlation coefficient (R) of 0.182 and weighted average of 47.1%. Similarly, the statistical analysis conducted on geographies consisting of 110,144,981 people shows a poor negative correlation between the proportion of Sudanese and percentage of population with at least associate's degree education in the United States with a correlation coefficient (R) of -0.198 and weighted average of 47.1%, a difference of 0.020%.
Associate's Degree Correlation Summary
| Measurement | South American | Sudanese |
| Minimum | 14.1% | 15.8% |
| Maximum | 83.4% | 74.0% |
| Range | 69.2% | 58.2% |
| Mean | 47.2% | 43.5% |
| Median | 46.3% | 44.6% |
| Interquartile 25% (IQ1) | 40.8% | 37.6% |
| Interquartile 75% (IQ3) | 51.0% | 50.2% |
| Interquartile Range (IQR) | 10.2% | 12.6% |
| Standard Deviation (Sample) | 12.9% | 12.9% |
| Standard Deviation (Population) | 12.8% | 12.8% |
Demographics Similar to South Americans and Sudanese by Associate's Degree
In terms of associate's degree, the demographic groups most similar to South Americans are Kenyan (47.1%, a difference of 0.010%), Immigrants from Germany (47.1%, a difference of 0.070%), Immigrants from Poland (47.1%, a difference of 0.12%), Immigrants from Kenya (47.2%, a difference of 0.14%), and Czech (47.2%, a difference of 0.16%). Similarly, the demographic groups most similar to Sudanese are Kenyan (47.1%, a difference of 0.030%), Immigrants from Germany (47.1%, a difference of 0.040%), Immigrants from Poland (47.1%, a difference of 0.090%), Immigrants from Kenya (47.2%, a difference of 0.16%), and Czech (47.2%, a difference of 0.18%).
| Demographics | Rating | Rank | Associate's Degree |
| Immigrants | Sudan | 77.9 /100 | #146 | Good 47.4% |
| Danes | 77.3 /100 | #147 | Good 47.4% |
| South American Indians | 76.7 /100 | #148 | Good 47.4% |
| Immigrants | Armenia | 76.6 /100 | #149 | Good 47.4% |
| Iraqis | 76.2 /100 | #150 | Good 47.4% |
| Immigrants | North Macedonia | 76.0 /100 | #151 | Good 47.4% |
| Immigrants | Afghanistan | 74.3 /100 | #152 | Good 47.3% |
| Czechs | 72.2 /100 | #153 | Good 47.2% |
| Immigrants | Kenya | 72.1 /100 | #154 | Good 47.2% |
| Kenyans | 70.6 /100 | #155 | Good 47.1% |
| South Americans | 70.5 /100 | #156 | Good 47.1% |
| Sudanese | 70.3 /100 | #157 | Good 47.1% |
| Immigrants | Germany | 69.7 /100 | #158 | Good 47.1% |
| Immigrants | Poland | 69.2 /100 | #159 | Good 47.1% |
| Scottish | 65.4 /100 | #160 | Good 46.9% |
| Scandinavians | 65.2 /100 | #161 | Good 46.9% |
| Immigrants | Africa | 63.2 /100 | #162 | Good 46.8% |
| Somalis | 62.5 /100 | #163 | Good 46.8% |
| Colombians | 62.4 /100 | #164 | Good 46.8% |
| Immigrants | South America | 59.9 /100 | #165 | Average 46.7% |
| Hungarians | 59.3 /100 | #166 | Average 46.7% |