South American vs Native/Alaskan Professional Degree
COMPARE
South American
Native/Alaskan
Professional Degree
Professional Degree Comparison
South Americans
Natives/Alaskans
4.7%
PROFESSIONAL DEGREE
85.6/ 100
METRIC RATING
139th/ 347
METRIC RANK
3.0%
PROFESSIONAL DEGREE
0.0/ 100
METRIC RATING
335th/ 347
METRIC RANK
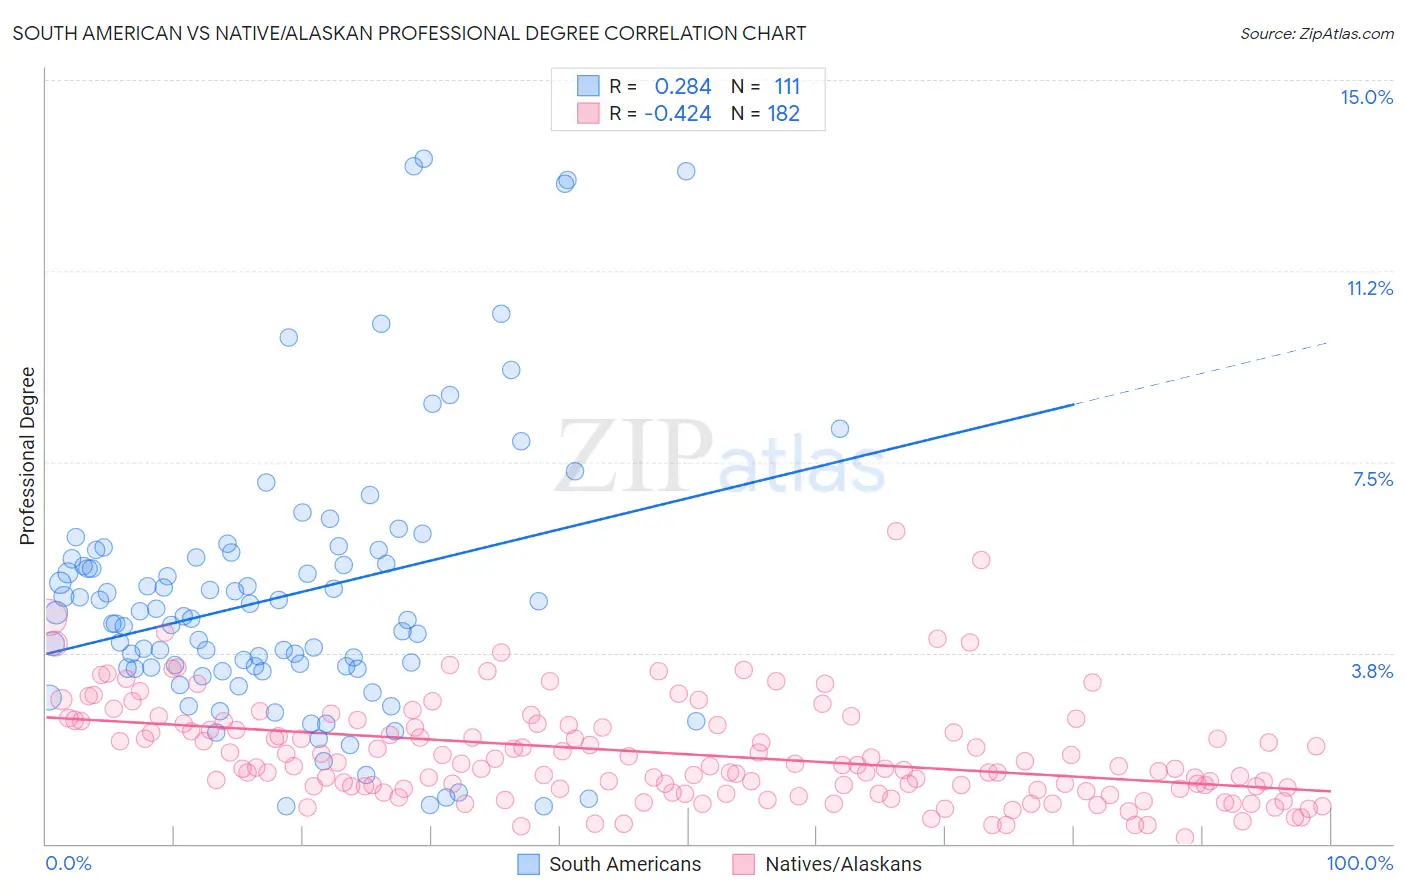
South American vs Native/Alaskan Professional Degree Correlation Chart
The statistical analysis conducted on geographies consisting of 492,254,354 people shows a weak positive correlation between the proportion of South Americans and percentage of population with at least professional degree education in the United States with a correlation coefficient (R) of 0.284 and weighted average of 4.7%. Similarly, the statistical analysis conducted on geographies consisting of 508,142,680 people shows a moderate negative correlation between the proportion of Natives/Alaskans and percentage of population with at least professional degree education in the United States with a correlation coefficient (R) of -0.424 and weighted average of 3.0%, a difference of 58.7%.
Professional Degree Correlation Summary
| Measurement | South American | Native/Alaskan |
| Minimum | 0.74% | 0.12% |
| Maximum | 13.5% | 6.1% |
| Range | 12.7% | 6.0% |
| Mean | 4.9% | 1.8% |
| Median | 4.4% | 1.5% |
| Interquartile 25% (IQ1) | 3.4% | 1.1% |
| Interquartile 75% (IQ3) | 5.6% | 2.3% |
| Interquartile Range (IQR) | 2.2% | 1.3% |
| Standard Deviation (Sample) | 2.7% | 1.0% |
| Standard Deviation (Population) | 2.7% | 1.0% |
Similar Demographics by Professional Degree
Demographics Similar to South Americans by Professional Degree
In terms of professional degree, the demographic groups most similar to South Americans are Canadian (4.7%, a difference of 0.34%), Basque (4.6%, a difference of 0.96%), Afghan (4.7%, a difference of 0.99%), Jordanian (4.7%, a difference of 1.0%), and Immigrants from Jordan (4.7%, a difference of 1.1%).
| Demographics | Rating | Rank | Professional Degree |
| Pakistanis | 90.9 /100 | #132 | Exceptional 4.8% |
| Italians | 90.2 /100 | #133 | Exceptional 4.8% |
| South American Indians | 89.9 /100 | #134 | Excellent 4.8% |
| Macedonians | 89.8 /100 | #135 | Excellent 4.8% |
| Immigrants | Jordan | 89.0 /100 | #136 | Excellent 4.7% |
| Jordanians | 88.9 /100 | #137 | Excellent 4.7% |
| Afghans | 88.8 /100 | #138 | Excellent 4.7% |
| South Americans | 85.6 /100 | #139 | Excellent 4.7% |
| Canadians | 84.4 /100 | #140 | Excellent 4.7% |
| Basques | 81.8 /100 | #141 | Excellent 4.6% |
| Sudanese | 81.3 /100 | #142 | Excellent 4.6% |
| Hungarians | 80.8 /100 | #143 | Excellent 4.6% |
| Immigrants | South America | 80.5 /100 | #144 | Excellent 4.6% |
| Uruguayans | 80.2 /100 | #145 | Excellent 4.6% |
| Luxembourgers | 78.7 /100 | #146 | Good 4.6% |
Demographics Similar to Natives/Alaskans by Professional Degree
In terms of professional degree, the demographic groups most similar to Natives/Alaskans are Pennsylvania German (3.0%, a difference of 0.56%), Fijian (2.9%, a difference of 1.0%), Arapaho (2.9%, a difference of 2.8%), Navajo (2.9%, a difference of 2.9%), and Immigrants from Central America (2.9%, a difference of 3.0%).
| Demographics | Rating | Rank | Professional Degree |
| Creek | 0.0 /100 | #328 | Tragic 3.1% |
| Bangladeshis | 0.0 /100 | #329 | Tragic 3.1% |
| Immigrants | Cabo Verde | 0.0 /100 | #330 | Tragic 3.1% |
| Kiowa | 0.0 /100 | #331 | Tragic 3.1% |
| Yakama | 0.0 /100 | #332 | Tragic 3.1% |
| Puget Sound Salish | 0.0 /100 | #333 | Tragic 3.1% |
| Pennsylvania Germans | 0.0 /100 | #334 | Tragic 3.0% |
| Natives/Alaskans | 0.0 /100 | #335 | Tragic 3.0% |
| Fijians | 0.0 /100 | #336 | Tragic 2.9% |
| Arapaho | 0.0 /100 | #337 | Tragic 2.9% |
| Navajo | 0.0 /100 | #338 | Tragic 2.9% |
| Immigrants | Central America | 0.0 /100 | #339 | Tragic 2.9% |
| Yup'ik | 0.0 /100 | #340 | Tragic 2.9% |
| Tohono O'odham | 0.0 /100 | #341 | Tragic 2.8% |
| Immigrants | Azores | 0.0 /100 | #342 | Tragic 2.8% |