South American vs Immigrants from Syria 2nd Grade
COMPARE
South American
Immigrants from Syria
2nd Grade
2nd Grade Comparison
South Americans
Immigrants from Syria
97.5%
2ND GRADE
0.9/ 100
METRIC RATING
246th/ 347
METRIC RANK
97.6%
2ND GRADE
4.0/ 100
METRIC RATING
226th/ 347
METRIC RANK
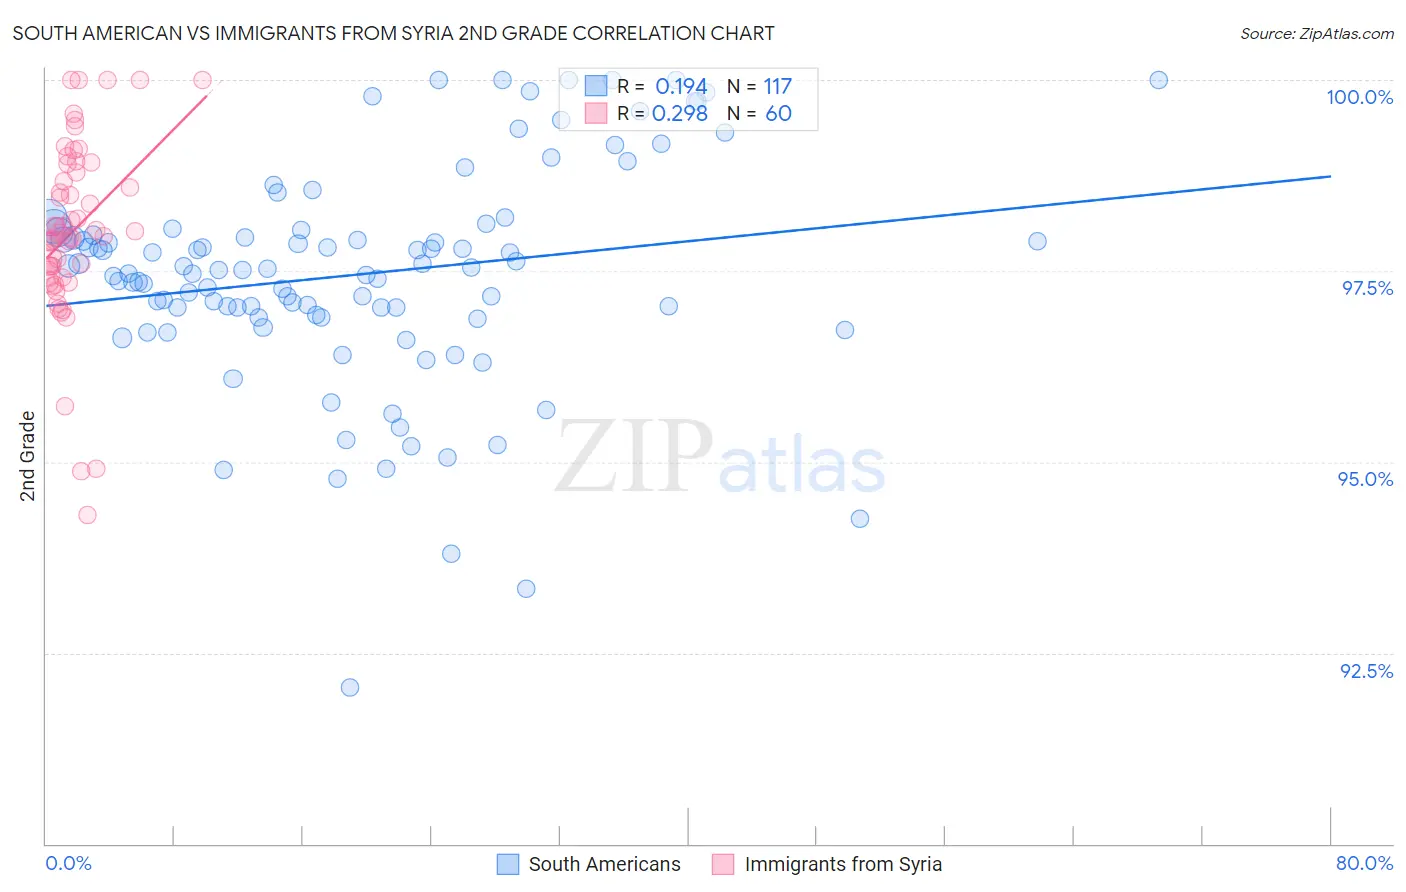
South American vs Immigrants from Syria 2nd Grade Correlation Chart
The statistical analysis conducted on geographies consisting of 494,178,447 people shows a poor positive correlation between the proportion of South Americans and percentage of population with at least 2nd grade education in the United States with a correlation coefficient (R) of 0.194 and weighted average of 97.5%. Similarly, the statistical analysis conducted on geographies consisting of 174,108,374 people shows a weak positive correlation between the proportion of Immigrants from Syria and percentage of population with at least 2nd grade education in the United States with a correlation coefficient (R) of 0.298 and weighted average of 97.6%, a difference of 0.12%.
2nd Grade Correlation Summary
| Measurement | South American | Immigrants from Syria |
| Minimum | 92.1% | 94.3% |
| Maximum | 100.0% | 100.0% |
| Range | 7.9% | 5.7% |
| Mean | 97.5% | 98.0% |
| Median | 97.5% | 98.0% |
| Interquartile 25% (IQ1) | 96.9% | 97.4% |
| Interquartile 75% (IQ3) | 98.0% | 98.8% |
| Interquartile Range (IQR) | 1.1% | 1.4% |
| Standard Deviation (Sample) | 1.4% | 1.2% |
| Standard Deviation (Population) | 1.4% | 1.2% |
Demographics Similar to South Americans and Immigrants from Syria by 2nd Grade
In terms of 2nd grade, the demographic groups most similar to South Americans are Immigrants from Eastern Africa (97.5%, a difference of 0.0%), Immigrants from Iraq (97.5%, a difference of 0.010%), Ethiopian (97.5%, a difference of 0.020%), Immigrants from Indonesia (97.5%, a difference of 0.020%), and Asian (97.5%, a difference of 0.020%). Similarly, the demographic groups most similar to Immigrants from Syria are Immigrants from Nepal (97.6%, a difference of 0.0%), Subsaharan African (97.6%, a difference of 0.010%), Immigrants from Costa Rica (97.6%, a difference of 0.020%), Senegalese (97.6%, a difference of 0.020%), and Immigrants from Pakistan (97.6%, a difference of 0.040%).
| Demographics | Rating | Rank | 2nd Grade |
| Immigrants | Syria | 4.0 /100 | #226 | Tragic 97.6% |
| Immigrants | Nepal | 4.0 /100 | #227 | Tragic 97.6% |
| Sub-Saharan Africans | 3.4 /100 | #228 | Tragic 97.6% |
| Immigrants | Costa Rica | 3.1 /100 | #229 | Tragic 97.6% |
| Senegalese | 3.1 /100 | #230 | Tragic 97.6% |
| Immigrants | Pakistan | 2.3 /100 | #231 | Tragic 97.6% |
| Immigrants | Western Asia | 2.1 /100 | #232 | Tragic 97.6% |
| Immigrants | Uruguay | 2.1 /100 | #233 | Tragic 97.6% |
| Immigrants | Malaysia | 2.0 /100 | #234 | Tragic 97.6% |
| Colombians | 1.9 /100 | #235 | Tragic 97.6% |
| Nigerians | 1.7 /100 | #236 | Tragic 97.6% |
| U.S. Virgin Islanders | 1.6 /100 | #237 | Tragic 97.6% |
| Immigrants | Eastern Asia | 1.6 /100 | #238 | Tragic 97.6% |
| Liberians | 1.6 /100 | #239 | Tragic 97.6% |
| Koreans | 1.5 /100 | #240 | Tragic 97.5% |
| Ethiopians | 1.2 /100 | #241 | Tragic 97.5% |
| Immigrants | Indonesia | 1.2 /100 | #242 | Tragic 97.5% |
| Asians | 1.1 /100 | #243 | Tragic 97.5% |
| Immigrants | Iraq | 1.0 /100 | #244 | Tragic 97.5% |
| Immigrants | Eastern Africa | 0.9 /100 | #245 | Tragic 97.5% |
| South Americans | 0.9 /100 | #246 | Tragic 97.5% |