South American vs Immigrants from Burma/Myanmar Doctorate Degree
COMPARE
South American
Immigrants from Burma/Myanmar
Doctorate Degree
Doctorate Degree Comparison
South Americans
Immigrants from Burma/Myanmar
1.8%
DOCTORATE DEGREE
29.5/ 100
METRIC RATING
191st/ 347
METRIC RANK
1.7%
DOCTORATE DEGREE
13.5/ 100
METRIC RATING
216th/ 347
METRIC RANK
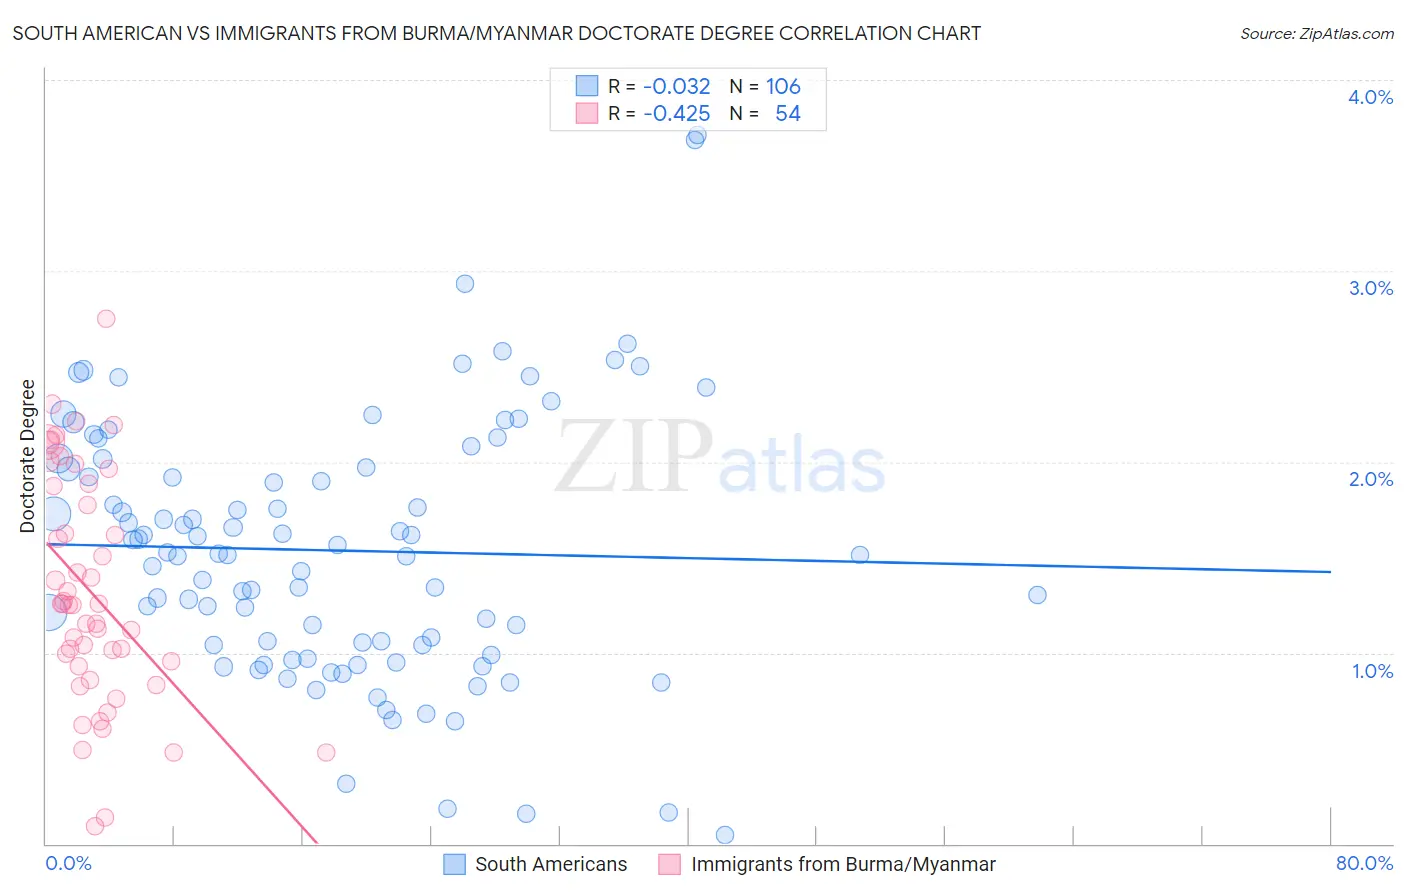
South American vs Immigrants from Burma/Myanmar Doctorate Degree Correlation Chart
The statistical analysis conducted on geographies consisting of 486,603,366 people shows no correlation between the proportion of South Americans and percentage of population with at least doctorate degree education in the United States with a correlation coefficient (R) of -0.032 and weighted average of 1.8%. Similarly, the statistical analysis conducted on geographies consisting of 171,860,396 people shows a moderate negative correlation between the proportion of Immigrants from Burma/Myanmar and percentage of population with at least doctorate degree education in the United States with a correlation coefficient (R) of -0.425 and weighted average of 1.7%, a difference of 3.9%.
Doctorate Degree Correlation Summary
| Measurement | South American | Immigrants from Burma/Myanmar |
| Minimum | 0.049% | 0.089% |
| Maximum | 3.7% | 2.7% |
| Range | 3.7% | 2.7% |
| Mean | 1.5% | 1.3% |
| Median | 1.5% | 1.3% |
| Interquartile 25% (IQ1) | 1.0% | 0.93% |
| Interquartile 75% (IQ3) | 2.0% | 1.9% |
| Interquartile Range (IQR) | 0.93% | 0.94% |
| Standard Deviation (Sample) | 0.68% | 0.60% |
| Standard Deviation (Population) | 0.68% | 0.59% |
Similar Demographics by Doctorate Degree
Demographics Similar to South Americans by Doctorate Degree
In terms of doctorate degree, the demographic groups most similar to South Americans are Immigrants from Costa Rica (1.8%, a difference of 0.12%), French Canadian (1.8%, a difference of 0.13%), German (1.8%, a difference of 0.18%), Dutch (1.8%, a difference of 0.39%), and German Russian (1.8%, a difference of 0.46%).
| Demographics | Rating | Rank | Doctorate Degree |
| Nigerians | 39.9 /100 | #184 | Fair 1.8% |
| Slovaks | 36.4 /100 | #185 | Fair 1.8% |
| Peruvians | 34.4 /100 | #186 | Fair 1.8% |
| Czechoslovakians | 33.0 /100 | #187 | Fair 1.8% |
| Germans | 30.5 /100 | #188 | Fair 1.8% |
| French Canadians | 30.2 /100 | #189 | Fair 1.8% |
| Immigrants | Costa Rica | 30.2 /100 | #190 | Fair 1.8% |
| South Americans | 29.5 /100 | #191 | Fair 1.8% |
| Dutch | 27.4 /100 | #192 | Fair 1.8% |
| German Russians | 27.1 /100 | #193 | Fair 1.8% |
| Uruguayans | 26.2 /100 | #194 | Fair 1.8% |
| Immigrants | Somalia | 25.4 /100 | #195 | Fair 1.8% |
| Sub-Saharan Africans | 25.1 /100 | #196 | Fair 1.8% |
| Chinese | 25.1 /100 | #197 | Fair 1.8% |
| Immigrants | Ghana | 24.6 /100 | #198 | Fair 1.8% |
Demographics Similar to Immigrants from Burma/Myanmar by Doctorate Degree
In terms of doctorate degree, the demographic groups most similar to Immigrants from Burma/Myanmar are Alaskan Athabascan (1.7%, a difference of 0.10%), Spanish American (1.7%, a difference of 0.21%), Pueblo (1.7%, a difference of 0.24%), Korean (1.7%, a difference of 0.25%), and Immigrants from South Eastern Asia (1.7%, a difference of 0.39%).
| Demographics | Rating | Rank | Doctorate Degree |
| Immigrants | Western Africa | 15.4 /100 | #209 | Poor 1.7% |
| Tongans | 15.1 /100 | #210 | Poor 1.7% |
| Immigrants | Armenia | 15.1 /100 | #211 | Poor 1.7% |
| Immigrants | South Eastern Asia | 14.7 /100 | #212 | Poor 1.7% |
| Koreans | 14.2 /100 | #213 | Poor 1.7% |
| Pueblo | 14.2 /100 | #214 | Poor 1.7% |
| Alaskan Athabascans | 13.8 /100 | #215 | Poor 1.7% |
| Immigrants | Burma/Myanmar | 13.5 /100 | #216 | Poor 1.7% |
| Spanish Americans | 12.9 /100 | #217 | Poor 1.7% |
| Tlingit-Haida | 11.9 /100 | #218 | Poor 1.7% |
| Immigrants | Iraq | 10.7 /100 | #219 | Poor 1.7% |
| Immigrants | Uruguay | 9.2 /100 | #220 | Tragic 1.7% |
| Immigrants | Nonimmigrants | 8.8 /100 | #221 | Tragic 1.7% |
| Immigrants | Venezuela | 8.7 /100 | #222 | Tragic 1.7% |
| Immigrants | Bosnia and Herzegovina | 7.8 /100 | #223 | Tragic 1.7% |