South American Indian vs Immigrants from Trinidad and Tobago 7th Grade
COMPARE
South American Indian
Immigrants from Trinidad and Tobago
7th Grade
7th Grade Comparison
South American Indians
Immigrants from Trinidad and Tobago
95.5%
7TH GRADE
2.0/ 100
METRIC RATING
241st/ 347
METRIC RANK
95.1%
7TH GRADE
0.1/ 100
METRIC RATING
278th/ 347
METRIC RANK
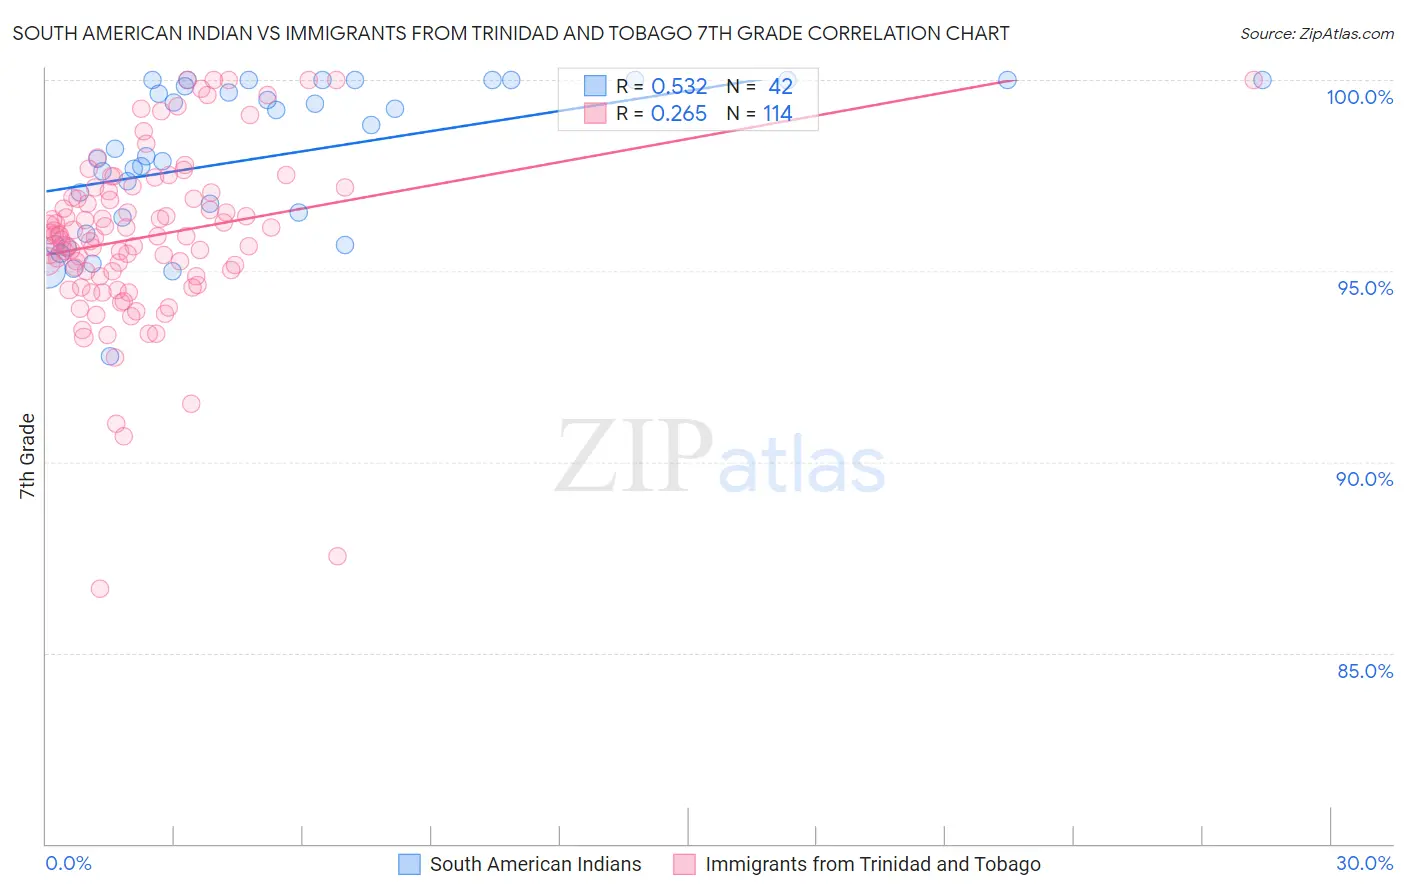
South American Indian vs Immigrants from Trinidad and Tobago 7th Grade Correlation Chart
The statistical analysis conducted on geographies consisting of 164,571,317 people shows a substantial positive correlation between the proportion of South American Indians and percentage of population with at least 7th grade education in the United States with a correlation coefficient (R) of 0.532 and weighted average of 95.5%. Similarly, the statistical analysis conducted on geographies consisting of 223,526,834 people shows a weak positive correlation between the proportion of Immigrants from Trinidad and Tobago and percentage of population with at least 7th grade education in the United States with a correlation coefficient (R) of 0.265 and weighted average of 95.1%, a difference of 0.43%.
7th Grade Correlation Summary
| Measurement | South American Indian | Immigrants from Trinidad and Tobago |
| Minimum | 92.8% | 86.7% |
| Maximum | 100.0% | 100.0% |
| Range | 7.2% | 13.3% |
| Mean | 98.0% | 95.9% |
| Median | 98.1% | 95.9% |
| Interquartile 25% (IQ1) | 96.4% | 94.9% |
| Interquartile 75% (IQ3) | 100.0% | 97.1% |
| Interquartile Range (IQR) | 3.6% | 2.2% |
| Standard Deviation (Sample) | 2.0% | 2.2% |
| Standard Deviation (Population) | 1.9% | 2.2% |
Similar Demographics by 7th Grade
Demographics Similar to South American Indians by 7th Grade
In terms of 7th grade, the demographic groups most similar to South American Indians are Immigrants from Sierra Leone (95.5%, a difference of 0.0%), Immigrants from Senegal (95.5%, a difference of 0.0%), Indian (Asian) (95.5%, a difference of 0.020%), Jamaican (95.5%, a difference of 0.020%), and Immigrants from Asia (95.5%, a difference of 0.030%).
| Demographics | Rating | Rank | 7th Grade |
| Nigerians | 3.0 /100 | #234 | Tragic 95.5% |
| Immigrants | Africa | 2.7 /100 | #235 | Tragic 95.5% |
| Asians | 2.6 /100 | #236 | Tragic 95.5% |
| Immigrants | Asia | 2.3 /100 | #237 | Tragic 95.5% |
| Indians (Asian) | 2.3 /100 | #238 | Tragic 95.5% |
| Jamaicans | 2.2 /100 | #239 | Tragic 95.5% |
| Immigrants | Sierra Leone | 2.0 /100 | #240 | Tragic 95.5% |
| South American Indians | 2.0 /100 | #241 | Tragic 95.5% |
| Immigrants | Senegal | 1.9 /100 | #242 | Tragic 95.5% |
| U.S. Virgin Islanders | 1.6 /100 | #243 | Tragic 95.4% |
| Uruguayans | 1.6 /100 | #244 | Tragic 95.4% |
| Immigrants | Middle Africa | 1.5 /100 | #245 | Tragic 95.4% |
| Ethiopians | 1.5 /100 | #246 | Tragic 95.4% |
| Tongans | 1.3 /100 | #247 | Tragic 95.4% |
| Paiute | 1.2 /100 | #248 | Tragic 95.4% |
Demographics Similar to Immigrants from Trinidad and Tobago by 7th Grade
In terms of 7th grade, the demographic groups most similar to Immigrants from Trinidad and Tobago are Barbadian (95.1%, a difference of 0.010%), Immigrants from Afghanistan (95.1%, a difference of 0.030%), Immigrants from St. Vincent and the Grenadines (95.0%, a difference of 0.030%), Tohono O'odham (95.0%, a difference of 0.040%), and Immigrants from Thailand (95.1%, a difference of 0.050%).
| Demographics | Rating | Rank | 7th Grade |
| Immigrants | South America | 0.2 /100 | #271 | Tragic 95.1% |
| Peruvians | 0.2 /100 | #272 | Tragic 95.1% |
| Immigrants | Uzbekistan | 0.2 /100 | #273 | Tragic 95.1% |
| Immigrants | Western Africa | 0.2 /100 | #274 | Tragic 95.1% |
| Immigrants | Colombia | 0.2 /100 | #275 | Tragic 95.1% |
| Immigrants | Thailand | 0.2 /100 | #276 | Tragic 95.1% |
| Immigrants | Afghanistan | 0.2 /100 | #277 | Tragic 95.1% |
| Immigrants | Trinidad and Tobago | 0.1 /100 | #278 | Tragic 95.1% |
| Barbadians | 0.1 /100 | #279 | Tragic 95.1% |
| Immigrants | St. Vincent and the Grenadines | 0.1 /100 | #280 | Tragic 95.0% |
| Tohono O'odham | 0.1 /100 | #281 | Tragic 95.0% |
| Immigrants | Bolivia | 0.1 /100 | #282 | Tragic 95.0% |
| Immigrants | Barbados | 0.1 /100 | #283 | Tragic 95.0% |
| Armenians | 0.1 /100 | #284 | Tragic 95.0% |
| Immigrants | Eritrea | 0.1 /100 | #285 | Tragic 94.9% |