South American Indian vs Eastern European Bachelor's Degree
COMPARE
South American Indian
Eastern European
Bachelor's Degree
Bachelor's Degree Comparison
South American Indians
Eastern Europeans
39.3%
BACHELOR'S DEGREE
83.6/ 100
METRIC RATING
141st/ 347
METRIC RANK
47.5%
BACHELOR'S DEGREE
100.0/ 100
METRIC RATING
17th/ 347
METRIC RANK
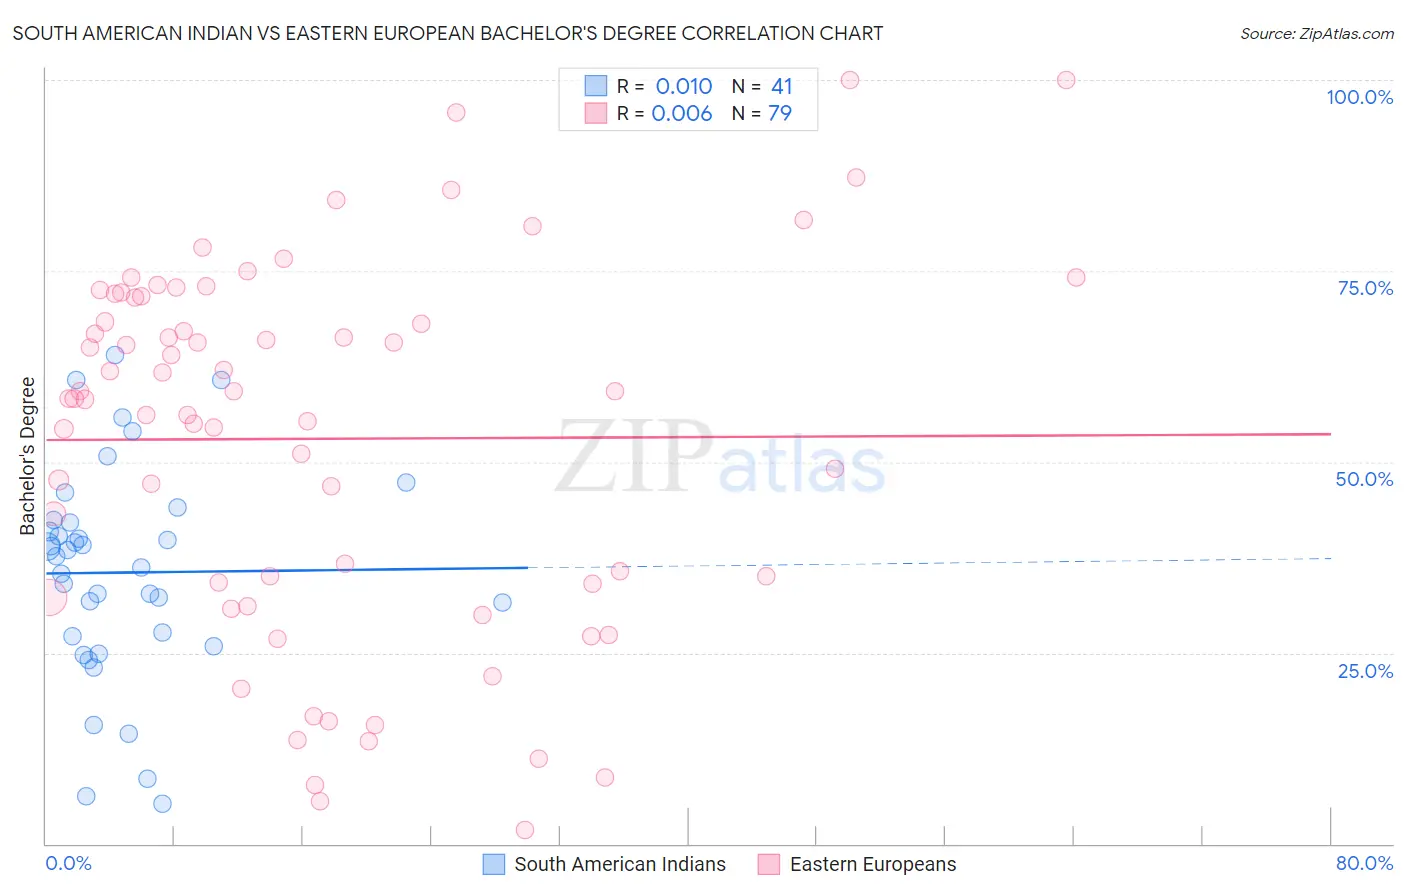
South American Indian vs Eastern European Bachelor's Degree Correlation Chart
The statistical analysis conducted on geographies consisting of 164,573,036 people shows no correlation between the proportion of South American Indians and percentage of population with at least bachelor's degree education in the United States with a correlation coefficient (R) of 0.010 and weighted average of 39.3%. Similarly, the statistical analysis conducted on geographies consisting of 461,197,677 people shows no correlation between the proportion of Eastern Europeans and percentage of population with at least bachelor's degree education in the United States with a correlation coefficient (R) of 0.006 and weighted average of 47.5%, a difference of 20.8%.
Bachelor's Degree Correlation Summary
| Measurement | South American Indian | Eastern European |
| Minimum | 5.3% | 1.8% |
| Maximum | 64.1% | 100.0% |
| Range | 58.8% | 98.2% |
| Mean | 35.5% | 53.0% |
| Median | 37.6% | 58.3% |
| Interquartile 25% (IQ1) | 26.5% | 34.0% |
| Interquartile 75% (IQ3) | 42.3% | 71.7% |
| Interquartile Range (IQR) | 15.8% | 37.7% |
| Standard Deviation (Sample) | 14.0% | 24.1% |
| Standard Deviation (Population) | 13.8% | 23.9% |
Similar Demographics by Bachelor's Degree
Demographics Similar to South American Indians by Bachelor's Degree
In terms of bachelor's degree, the demographic groups most similar to South American Indians are Immigrants from Armenia (39.4%, a difference of 0.090%), Immigrants from Sudan (39.4%, a difference of 0.16%), Immigrants from North Macedonia (39.2%, a difference of 0.32%), European (39.5%, a difference of 0.35%), and Icelander (39.5%, a difference of 0.53%).
| Demographics | Rating | Rank | Bachelor's Degree |
| Assyrians/Chaldeans/Syriacs | 89.4 /100 | #134 | Excellent 39.8% |
| Luxembourgers | 89.1 /100 | #135 | Excellent 39.8% |
| Pakistanis | 88.2 /100 | #136 | Excellent 39.7% |
| Icelanders | 86.5 /100 | #137 | Excellent 39.5% |
| Europeans | 85.6 /100 | #138 | Excellent 39.5% |
| Immigrants | Sudan | 84.5 /100 | #139 | Excellent 39.4% |
| Immigrants | Armenia | 84.1 /100 | #140 | Excellent 39.4% |
| South American Indians | 83.6 /100 | #141 | Excellent 39.3% |
| Immigrants | North Macedonia | 81.6 /100 | #142 | Excellent 39.2% |
| Poles | 79.8 /100 | #143 | Good 39.1% |
| Immigrants | Afghanistan | 79.7 /100 | #144 | Good 39.1% |
| Slovenes | 79.5 /100 | #145 | Good 39.1% |
| Swedes | 79.2 /100 | #146 | Good 39.1% |
| Immigrants | Sierra Leone | 79.0 /100 | #147 | Good 39.0% |
| Iraqis | 78.1 /100 | #148 | Good 39.0% |
Demographics Similar to Eastern Europeans by Bachelor's Degree
In terms of bachelor's degree, the demographic groups most similar to Eastern Europeans are Indian (Asian) (47.4%, a difference of 0.15%), Cambodian (47.2%, a difference of 0.58%), Immigrants from Switzerland (47.1%, a difference of 0.80%), Immigrants from Ireland (47.1%, a difference of 0.81%), and Soviet Union (47.9%, a difference of 0.86%).
| Demographics | Rating | Rank | Bachelor's Degree |
| Cypriots | 100.0 /100 | #10 | Exceptional 49.0% |
| Immigrants | Australia | 100.0 /100 | #11 | Exceptional 48.5% |
| Immigrants | China | 100.0 /100 | #12 | Exceptional 48.4% |
| Immigrants | South Central Asia | 100.0 /100 | #13 | Exceptional 48.3% |
| Immigrants | Hong Kong | 100.0 /100 | #14 | Exceptional 48.2% |
| Immigrants | Eastern Asia | 100.0 /100 | #15 | Exceptional 48.1% |
| Soviet Union | 100.0 /100 | #16 | Exceptional 47.9% |
| Eastern Europeans | 100.0 /100 | #17 | Exceptional 47.5% |
| Indians (Asian) | 100.0 /100 | #18 | Exceptional 47.4% |
| Cambodians | 100.0 /100 | #19 | Exceptional 47.2% |
| Immigrants | Switzerland | 100.0 /100 | #20 | Exceptional 47.1% |
| Immigrants | Ireland | 100.0 /100 | #21 | Exceptional 47.1% |
| Immigrants | Belgium | 100.0 /100 | #22 | Exceptional 47.0% |
| Immigrants | Sweden | 100.0 /100 | #23 | Exceptional 47.0% |
| Immigrants | Korea | 100.0 /100 | #24 | Exceptional 47.0% |