South African vs Immigrants Doctorate Degree
COMPARE
South African
Immigrants
Doctorate Degree
Doctorate Degree Comparison
South Africans
Immigrants
2.3%
DOCTORATE DEGREE
99.9/ 100
METRIC RATING
59th/ 347
METRIC RANK
1.8%
DOCTORATE DEGREE
46.2/ 100
METRIC RATING
181st/ 347
METRIC RANK
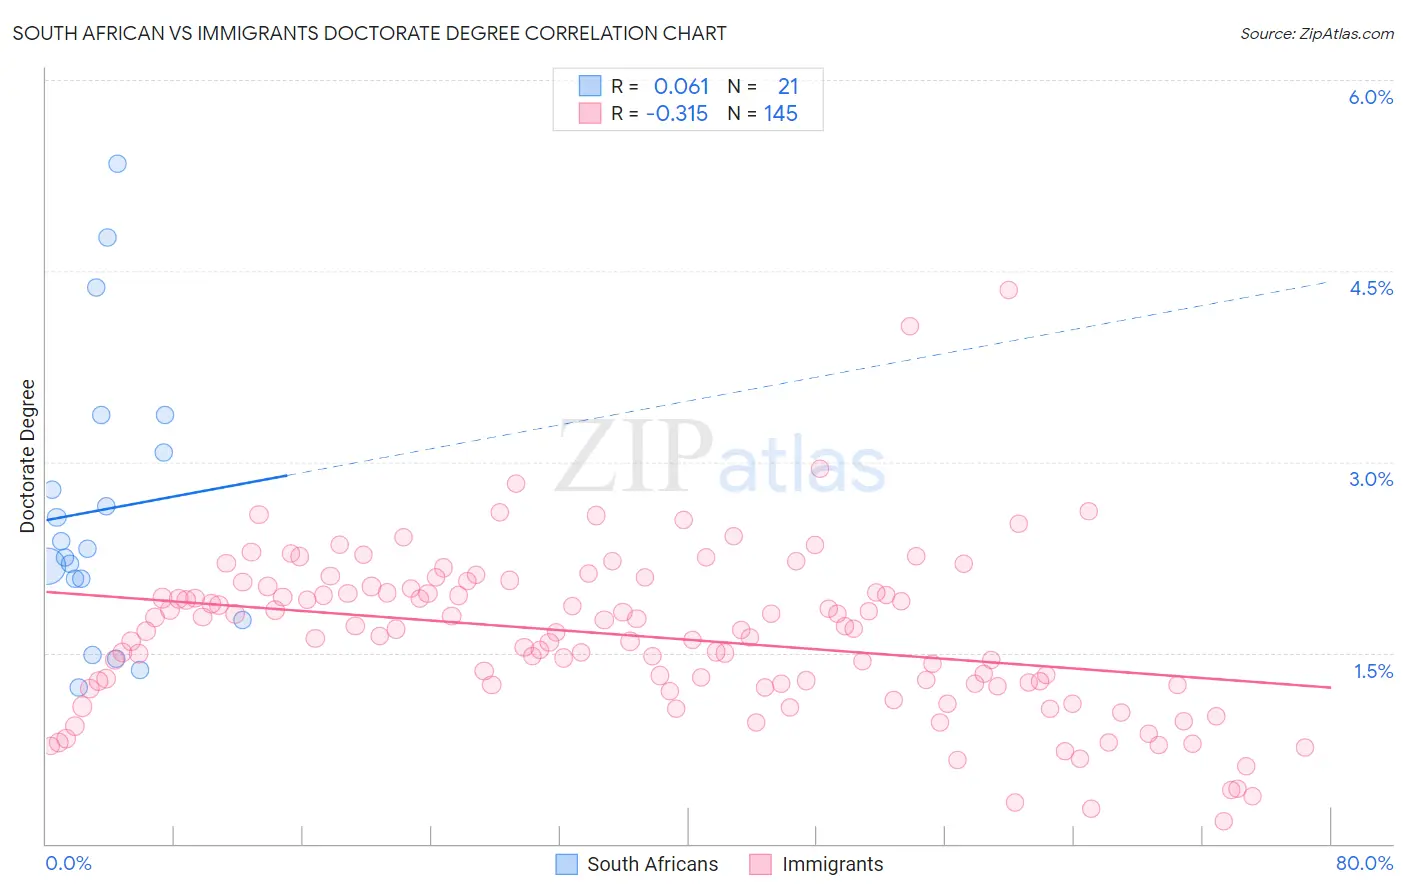
South African vs Immigrants Doctorate Degree Correlation Chart
The statistical analysis conducted on geographies consisting of 182,049,021 people shows a slight positive correlation between the proportion of South Africans and percentage of population with at least doctorate degree education in the United States with a correlation coefficient (R) of 0.061 and weighted average of 2.3%. Similarly, the statistical analysis conducted on geographies consisting of 551,358,177 people shows a mild negative correlation between the proportion of Immigrants and percentage of population with at least doctorate degree education in the United States with a correlation coefficient (R) of -0.315 and weighted average of 1.8%, a difference of 28.0%.
Doctorate Degree Correlation Summary
| Measurement | South African | Immigrants |
| Minimum | 1.2% | 0.18% |
| Maximum | 5.3% | 4.4% |
| Range | 4.1% | 4.2% |
| Mean | 2.6% | 1.6% |
| Median | 2.3% | 1.7% |
| Interquartile 25% (IQ1) | 1.9% | 1.2% |
| Interquartile 75% (IQ3) | 3.2% | 2.0% |
| Interquartile Range (IQR) | 1.3% | 0.74% |
| Standard Deviation (Sample) | 1.1% | 0.64% |
| Standard Deviation (Population) | 1.1% | 0.64% |
Similar Demographics by Doctorate Degree
Demographics Similar to South Africans by Doctorate Degree
In terms of doctorate degree, the demographic groups most similar to South Africans are Immigrants from Serbia (2.3%, a difference of 0.020%), Ethiopian (2.3%, a difference of 0.44%), Immigrants from Ethiopia (2.4%, a difference of 0.56%), Bhutanese (2.3%, a difference of 0.79%), and Immigrants from Czechoslovakia (2.4%, a difference of 1.0%).
| Demographics | Rating | Rank | Doctorate Degree |
| Bulgarians | 100.0 /100 | #52 | Exceptional 2.4% |
| Immigrants | Latvia | 100.0 /100 | #53 | Exceptional 2.4% |
| Immigrants | Indonesia | 100.0 /100 | #54 | Exceptional 2.4% |
| Bolivians | 100.0 /100 | #55 | Exceptional 2.4% |
| Immigrants | Czechoslovakia | 100.0 /100 | #56 | Exceptional 2.4% |
| Immigrants | Ethiopia | 100.0 /100 | #57 | Exceptional 2.4% |
| Ethiopians | 99.9 /100 | #58 | Exceptional 2.3% |
| South Africans | 99.9 /100 | #59 | Exceptional 2.3% |
| Immigrants | Serbia | 99.9 /100 | #60 | Exceptional 2.3% |
| Bhutanese | 99.9 /100 | #61 | Exceptional 2.3% |
| Immigrants | Europe | 99.9 /100 | #62 | Exceptional 2.3% |
| Laotians | 99.9 /100 | #63 | Exceptional 2.3% |
| Immigrants | Greece | 99.9 /100 | #64 | Exceptional 2.3% |
| Paraguayans | 99.9 /100 | #65 | Exceptional 2.3% |
| Argentineans | 99.9 /100 | #66 | Exceptional 2.3% |
Demographics Similar to Immigrants by Doctorate Degree
In terms of doctorate degree, the demographic groups most similar to Immigrants are Scandinavian (1.8%, a difference of 0.26%), Immigrants from Afghanistan (1.8%, a difference of 0.29%), Ghanaian (1.8%, a difference of 0.31%), French (1.8%, a difference of 0.38%), and Iraqi (1.8%, a difference of 0.44%).
| Demographics | Rating | Rank | Doctorate Degree |
| Immigrants | Bangladesh | 50.0 /100 | #174 | Average 1.8% |
| Immigrants | Thailand | 49.4 /100 | #175 | Average 1.8% |
| Spanish | 49.3 /100 | #176 | Average 1.8% |
| Iraqis | 49.2 /100 | #177 | Average 1.8% |
| French | 48.8 /100 | #178 | Average 1.8% |
| Ghanaians | 48.3 /100 | #179 | Average 1.8% |
| Scandinavians | 48.0 /100 | #180 | Average 1.8% |
| Immigrants | Immigrants | 46.2 /100 | #181 | Average 1.8% |
| Immigrants | Afghanistan | 44.3 /100 | #182 | Average 1.8% |
| Finns | 42.1 /100 | #183 | Average 1.8% |
| Nigerians | 39.9 /100 | #184 | Fair 1.8% |
| Slovaks | 36.4 /100 | #185 | Fair 1.8% |
| Peruvians | 34.4 /100 | #186 | Fair 1.8% |
| Czechoslovakians | 33.0 /100 | #187 | Fair 1.8% |
| Germans | 30.5 /100 | #188 | Fair 1.8% |