Somali vs Swedish 1st Grade
COMPARE
Somali
Swedish
1st Grade
1st Grade Comparison
Somalis
Swedes
97.0%
1ST GRADE
0.0/ 100
METRIC RATING
303rd/ 347
METRIC RANK
98.6%
1ST GRADE
100.0/ 100
METRIC RATING
15th/ 347
METRIC RANK
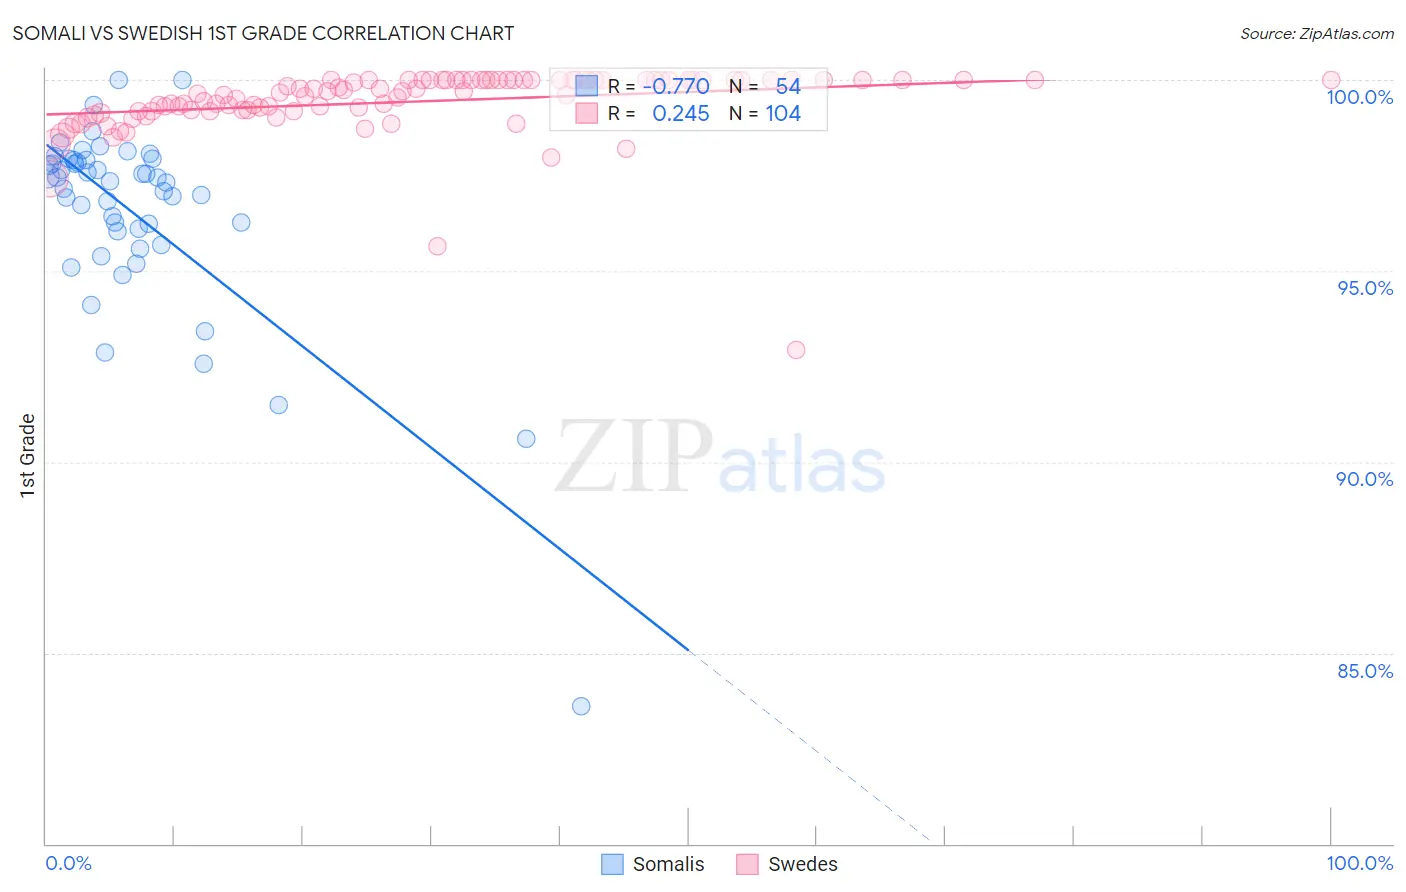
Somali vs Swedish 1st Grade Correlation Chart
The statistical analysis conducted on geographies consisting of 99,332,457 people shows a strong negative correlation between the proportion of Somalis and percentage of population with at least 1st grade education in the United States with a correlation coefficient (R) of -0.770 and weighted average of 97.0%. Similarly, the statistical analysis conducted on geographies consisting of 539,231,492 people shows a weak positive correlation between the proportion of Swedes and percentage of population with at least 1st grade education in the United States with a correlation coefficient (R) of 0.245 and weighted average of 98.6%, a difference of 1.7%.
1st Grade Correlation Summary
| Measurement | Somali | Swedish |
| Minimum | 83.6% | 92.9% |
| Maximum | 100.0% | 100.0% |
| Range | 16.4% | 7.1% |
| Mean | 96.5% | 99.4% |
| Median | 97.3% | 99.7% |
| Interquartile 25% (IQ1) | 96.0% | 99.2% |
| Interquartile 75% (IQ3) | 97.9% | 100.0% |
| Interquartile Range (IQR) | 1.9% | 0.81% |
| Standard Deviation (Sample) | 2.6% | 0.92% |
| Standard Deviation (Population) | 2.6% | 0.92% |
Similar Demographics by 1st Grade
Demographics Similar to Somalis by 1st Grade
In terms of 1st grade, the demographic groups most similar to Somalis are Nicaraguan (97.0%, a difference of 0.020%), Ecuadorian (97.0%, a difference of 0.020%), Immigrants from Caribbean (97.0%, a difference of 0.030%), Immigrants from South Eastern Asia (97.1%, a difference of 0.050%), and Belizean (96.9%, a difference of 0.070%).
| Demographics | Rating | Rank | 1st Grade |
| Immigrants | Eritrea | 0.0 /100 | #296 | Tragic 97.2% |
| Central American Indians | 0.0 /100 | #297 | Tragic 97.1% |
| Immigrants | Dominica | 0.0 /100 | #298 | Tragic 97.1% |
| Immigrants | Cuba | 0.0 /100 | #299 | Tragic 97.1% |
| Haitians | 0.0 /100 | #300 | Tragic 97.1% |
| Immigrants | South Eastern Asia | 0.0 /100 | #301 | Tragic 97.1% |
| Immigrants | Caribbean | 0.0 /100 | #302 | Tragic 97.0% |
| Somalis | 0.0 /100 | #303 | Tragic 97.0% |
| Nicaraguans | 0.0 /100 | #304 | Tragic 97.0% |
| Ecuadorians | 0.0 /100 | #305 | Tragic 97.0% |
| Belizeans | 0.0 /100 | #306 | Tragic 96.9% |
| Immigrants | Somalia | 0.0 /100 | #307 | Tragic 96.9% |
| Hispanics or Latinos | 0.0 /100 | #308 | Tragic 96.9% |
| Immigrants | Haiti | 0.0 /100 | #309 | Tragic 96.9% |
| Immigrants | Azores | 0.0 /100 | #310 | Tragic 96.9% |
Demographics Similar to Swedes by 1st Grade
In terms of 1st grade, the demographic groups most similar to Swedes are Carpatho Rusyn (98.6%, a difference of 0.010%), English (98.6%, a difference of 0.010%), Aleut (98.6%, a difference of 0.010%), Scottish (98.6%, a difference of 0.010%), and Dutch (98.6%, a difference of 0.020%).
| Demographics | Rating | Rank | 1st Grade |
| Norwegians | 100.0 /100 | #8 | Exceptional 98.7% |
| Slovaks | 100.0 /100 | #9 | Exceptional 98.7% |
| Germans | 100.0 /100 | #10 | Exceptional 98.7% |
| Tlingit-Haida | 100.0 /100 | #11 | Exceptional 98.7% |
| Slovenes | 100.0 /100 | #12 | Exceptional 98.7% |
| Carpatho Rusyns | 100.0 /100 | #13 | Exceptional 98.6% |
| English | 100.0 /100 | #14 | Exceptional 98.6% |
| Swedes | 100.0 /100 | #15 | Exceptional 98.6% |
| Aleuts | 100.0 /100 | #16 | Exceptional 98.6% |
| Scottish | 100.0 /100 | #17 | Exceptional 98.6% |
| Dutch | 100.0 /100 | #18 | Exceptional 98.6% |
| Irish | 100.0 /100 | #19 | Exceptional 98.6% |
| Sioux | 100.0 /100 | #20 | Exceptional 98.6% |
| Arapaho | 100.0 /100 | #21 | Exceptional 98.6% |
| Pennsylvania Germans | 100.0 /100 | #22 | Exceptional 98.6% |