Somali vs South African 10th Grade
COMPARE
Somali
South African
10th Grade
10th Grade Comparison
Somalis
South Africans
93.2%
10TH GRADE
6.2/ 100
METRIC RATING
225th/ 347
METRIC RANK
94.7%
10TH GRADE
98.8/ 100
METRIC RATING
90th/ 347
METRIC RANK
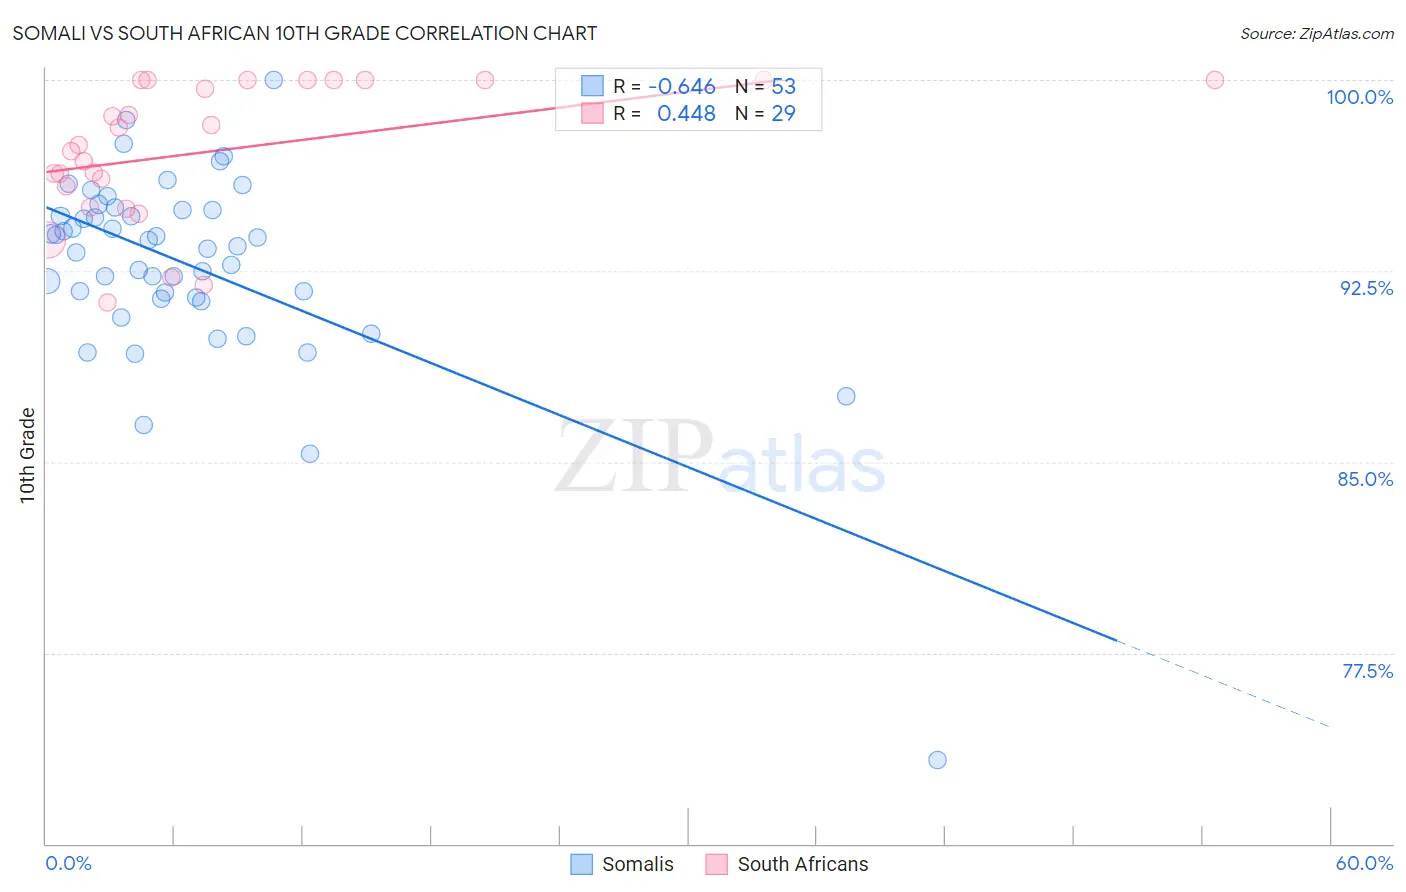
Somali vs South African 10th Grade Correlation Chart
The statistical analysis conducted on geographies consisting of 99,330,527 people shows a significant negative correlation between the proportion of Somalis and percentage of population with at least 10th grade education in the United States with a correlation coefficient (R) of -0.646 and weighted average of 93.2%. Similarly, the statistical analysis conducted on geographies consisting of 182,604,532 people shows a moderate positive correlation between the proportion of South Africans and percentage of population with at least 10th grade education in the United States with a correlation coefficient (R) of 0.448 and weighted average of 94.7%, a difference of 1.6%.
10th Grade Correlation Summary
| Measurement | Somali | South African |
| Minimum | 73.3% | 91.3% |
| Maximum | 100.0% | 100.0% |
| Range | 26.7% | 8.7% |
| Mean | 92.8% | 97.2% |
| Median | 93.5% | 97.5% |
| Interquartile 25% (IQ1) | 91.4% | 95.4% |
| Interquartile 75% (IQ3) | 94.9% | 100.0% |
| Interquartile Range (IQR) | 3.5% | 4.6% |
| Standard Deviation (Sample) | 3.9% | 2.7% |
| Standard Deviation (Population) | 3.9% | 2.6% |
Similar Demographics by 10th Grade
Demographics Similar to Somalis by 10th Grade
In terms of 10th grade, the demographic groups most similar to Somalis are Korean (93.2%, a difference of 0.0%), Black/African American (93.2%, a difference of 0.0%), Immigrants from China (93.2%, a difference of 0.010%), Bolivian (93.2%, a difference of 0.020%), and Immigrants from Ethiopia (93.1%, a difference of 0.040%).
| Demographics | Rating | Rank | 10th Grade |
| Immigrants | Liberia | 10.2 /100 | #218 | Poor 93.3% |
| Seminole | 10.2 /100 | #219 | Poor 93.3% |
| Tongans | 9.5 /100 | #220 | Tragic 93.3% |
| Immigrants | Southern Europe | 8.9 /100 | #221 | Tragic 93.2% |
| Ethiopians | 7.9 /100 | #222 | Tragic 93.2% |
| Immigrants | Sierra Leone | 7.6 /100 | #223 | Tragic 93.2% |
| Bolivians | 6.7 /100 | #224 | Tragic 93.2% |
| Somalis | 6.2 /100 | #225 | Tragic 93.2% |
| Koreans | 6.1 /100 | #226 | Tragic 93.2% |
| Blacks/African Americans | 6.0 /100 | #227 | Tragic 93.2% |
| Immigrants | China | 5.9 /100 | #228 | Tragic 93.2% |
| Immigrants | Ethiopia | 5.1 /100 | #229 | Tragic 93.1% |
| Immigrants | Africa | 5.0 /100 | #230 | Tragic 93.1% |
| South American Indians | 4.9 /100 | #231 | Tragic 93.1% |
| Bahamians | 4.9 /100 | #232 | Tragic 93.1% |
Demographics Similar to South Africans by 10th Grade
In terms of 10th grade, the demographic groups most similar to South Africans are Immigrants from Moldova (94.7%, a difference of 0.010%), White/Caucasian (94.7%, a difference of 0.010%), Immigrants from Japan (94.7%, a difference of 0.020%), Immigrants from Saudi Arabia (94.7%, a difference of 0.030%), and Crow (94.7%, a difference of 0.040%).
| Demographics | Rating | Rank | 10th Grade |
| Immigrants | Western Europe | 99.1 /100 | #83 | Exceptional 94.7% |
| Icelanders | 99.1 /100 | #84 | Exceptional 94.7% |
| Crow | 99.0 /100 | #85 | Exceptional 94.7% |
| Puget Sound Salish | 99.0 /100 | #86 | Exceptional 94.7% |
| Immigrants | Saudi Arabia | 99.0 /100 | #87 | Exceptional 94.7% |
| Immigrants | Japan | 99.0 /100 | #88 | Exceptional 94.7% |
| Immigrants | Moldova | 98.9 /100 | #89 | Exceptional 94.7% |
| South Africans | 98.8 /100 | #90 | Exceptional 94.7% |
| Whites/Caucasians | 98.8 /100 | #91 | Exceptional 94.7% |
| Yugoslavians | 98.4 /100 | #92 | Exceptional 94.6% |
| Soviet Union | 98.3 /100 | #93 | Exceptional 94.6% |
| Immigrants | Germany | 98.3 /100 | #94 | Exceptional 94.6% |
| Menominee | 98.3 /100 | #95 | Exceptional 94.6% |
| Immigrants | Switzerland | 98.3 /100 | #96 | Exceptional 94.6% |
| Lebanese | 98.3 /100 | #97 | Exceptional 94.6% |