Somali vs Immigrants from Lebanon Associate's Degree
COMPARE
Somali
Immigrants from Lebanon
Associate's Degree
Associate's Degree Comparison
Somalis
Immigrants from Lebanon
46.8%
ASSOCIATE'S DEGREE
62.5/ 100
METRIC RATING
163rd/ 347
METRIC RANK
50.5%
ASSOCIATE'S DEGREE
99.1/ 100
METRIC RATING
77th/ 347
METRIC RANK
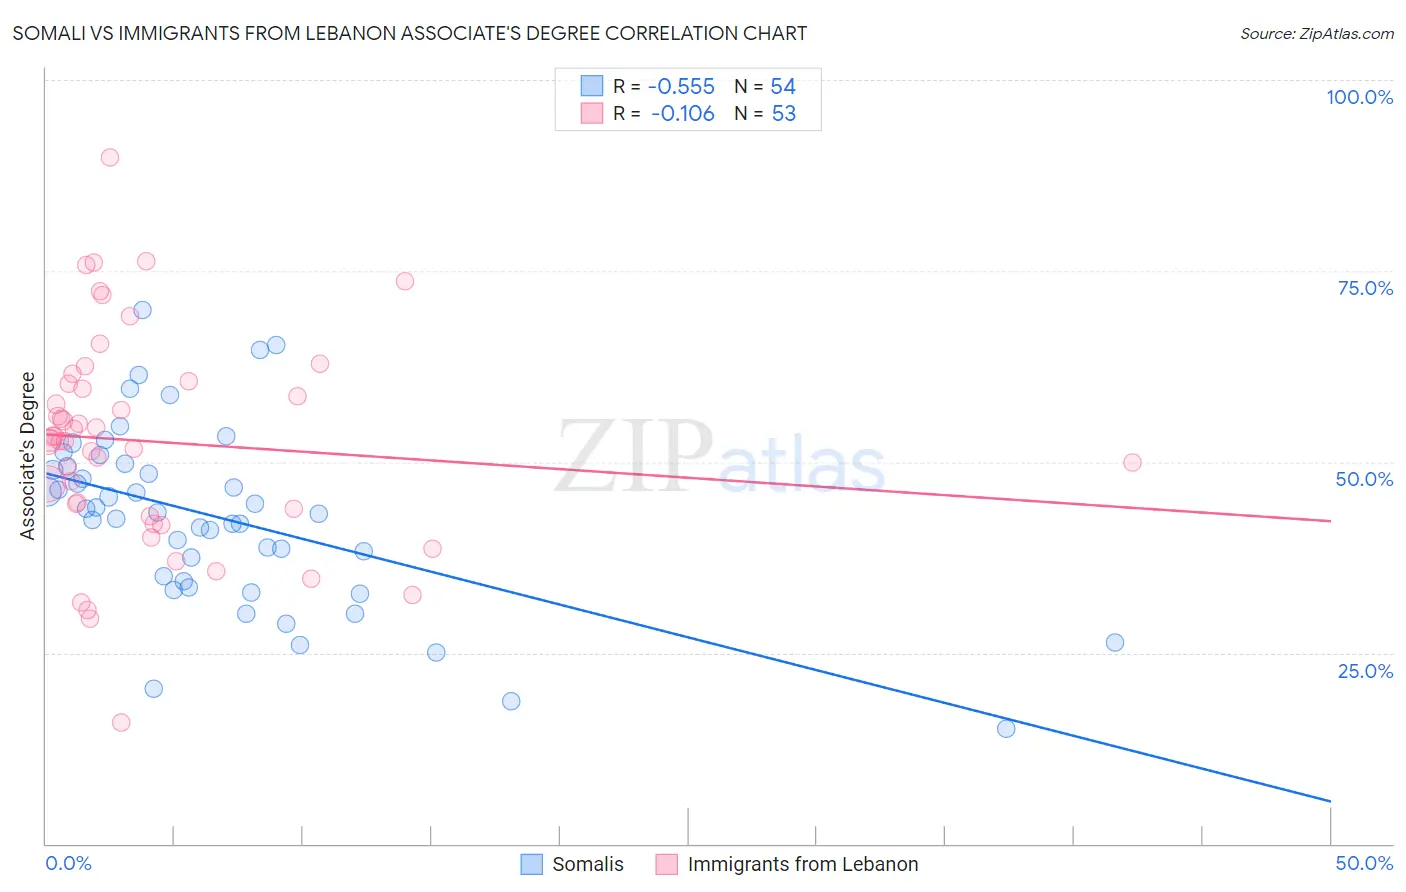
Somali vs Immigrants from Lebanon Associate's Degree Correlation Chart
The statistical analysis conducted on geographies consisting of 99,330,256 people shows a substantial negative correlation between the proportion of Somalis and percentage of population with at least associate's degree education in the United States with a correlation coefficient (R) of -0.555 and weighted average of 46.8%. Similarly, the statistical analysis conducted on geographies consisting of 217,164,247 people shows a poor negative correlation between the proportion of Immigrants from Lebanon and percentage of population with at least associate's degree education in the United States with a correlation coefficient (R) of -0.106 and weighted average of 50.5%, a difference of 7.9%.
Associate's Degree Correlation Summary
| Measurement | Somali | Immigrants from Lebanon |
| Minimum | 15.0% | 15.9% |
| Maximum | 69.9% | 89.8% |
| Range | 54.9% | 73.9% |
| Mean | 42.6% | 52.7% |
| Median | 43.3% | 52.8% |
| Interquartile 25% (IQ1) | 34.4% | 43.4% |
| Interquartile 75% (IQ3) | 49.4% | 60.5% |
| Interquartile Range (IQR) | 15.0% | 17.1% |
| Standard Deviation (Sample) | 11.7% | 14.1% |
| Standard Deviation (Population) | 11.6% | 13.9% |
Similar Demographics by Associate's Degree
Demographics Similar to Somalis by Associate's Degree
In terms of associate's degree, the demographic groups most similar to Somalis are Colombian (46.8%, a difference of 0.010%), Immigrants from Africa (46.8%, a difference of 0.060%), Immigrants from South America (46.7%, a difference of 0.21%), Scandinavian (46.9%, a difference of 0.22%), and Scottish (46.9%, a difference of 0.23%).
| Demographics | Rating | Rank | Associate's Degree |
| South Americans | 70.5 /100 | #156 | Good 47.1% |
| Sudanese | 70.3 /100 | #157 | Good 47.1% |
| Immigrants | Germany | 69.7 /100 | #158 | Good 47.1% |
| Immigrants | Poland | 69.2 /100 | #159 | Good 47.1% |
| Scottish | 65.4 /100 | #160 | Good 46.9% |
| Scandinavians | 65.2 /100 | #161 | Good 46.9% |
| Immigrants | Africa | 63.2 /100 | #162 | Good 46.8% |
| Somalis | 62.5 /100 | #163 | Good 46.8% |
| Colombians | 62.4 /100 | #164 | Good 46.8% |
| Immigrants | South America | 59.9 /100 | #165 | Average 46.7% |
| Hungarians | 59.3 /100 | #166 | Average 46.7% |
| Immigrants | Sierra Leone | 59.2 /100 | #167 | Average 46.7% |
| Immigrants | Somalia | 55.5 /100 | #168 | Average 46.5% |
| Uruguayans | 55.4 /100 | #169 | Average 46.5% |
| Irish | 53.6 /100 | #170 | Average 46.5% |
Demographics Similar to Immigrants from Lebanon by Associate's Degree
In terms of associate's degree, the demographic groups most similar to Immigrants from Lebanon are Immigrants from Zimbabwe (50.5%, a difference of 0.030%), Immigrants from Eastern Europe (50.5%, a difference of 0.040%), Ethiopian (50.4%, a difference of 0.060%), Armenian (50.4%, a difference of 0.090%), and Maltese (50.4%, a difference of 0.16%).
| Demographics | Rating | Rank | Associate's Degree |
| Immigrants | Argentina | 99.5 /100 | #70 | Exceptional 50.9% |
| Immigrants | Romania | 99.5 /100 | #71 | Exceptional 50.9% |
| Immigrants | Pakistan | 99.5 /100 | #72 | Exceptional 50.9% |
| Carpatho Rusyns | 99.3 /100 | #73 | Exceptional 50.6% |
| Lithuanians | 99.3 /100 | #74 | Exceptional 50.6% |
| Immigrants | Scotland | 99.3 /100 | #75 | Exceptional 50.6% |
| Immigrants | Zimbabwe | 99.2 /100 | #76 | Exceptional 50.5% |
| Immigrants | Lebanon | 99.1 /100 | #77 | Exceptional 50.5% |
| Immigrants | Eastern Europe | 99.1 /100 | #78 | Exceptional 50.5% |
| Ethiopians | 99.1 /100 | #79 | Exceptional 50.4% |
| Armenians | 99.1 /100 | #80 | Exceptional 50.4% |
| Maltese | 99.1 /100 | #81 | Exceptional 50.4% |
| Greeks | 98.9 /100 | #82 | Exceptional 50.3% |
| Immigrants | Uzbekistan | 98.9 /100 | #83 | Exceptional 50.3% |
| Immigrants | Hungary | 98.9 /100 | #84 | Exceptional 50.2% |