Slovene vs Immigrants from Western Africa 8th Grade
COMPARE
Slovene
Immigrants from Western Africa
8th Grade
8th Grade Comparison
Slovenes
Immigrants from Western Africa
97.5%
8TH GRADE
100.0/ 100
METRIC RATING
10th/ 347
METRIC RANK
94.8%
8TH GRADE
0.2/ 100
METRIC RATING
273rd/ 347
METRIC RANK
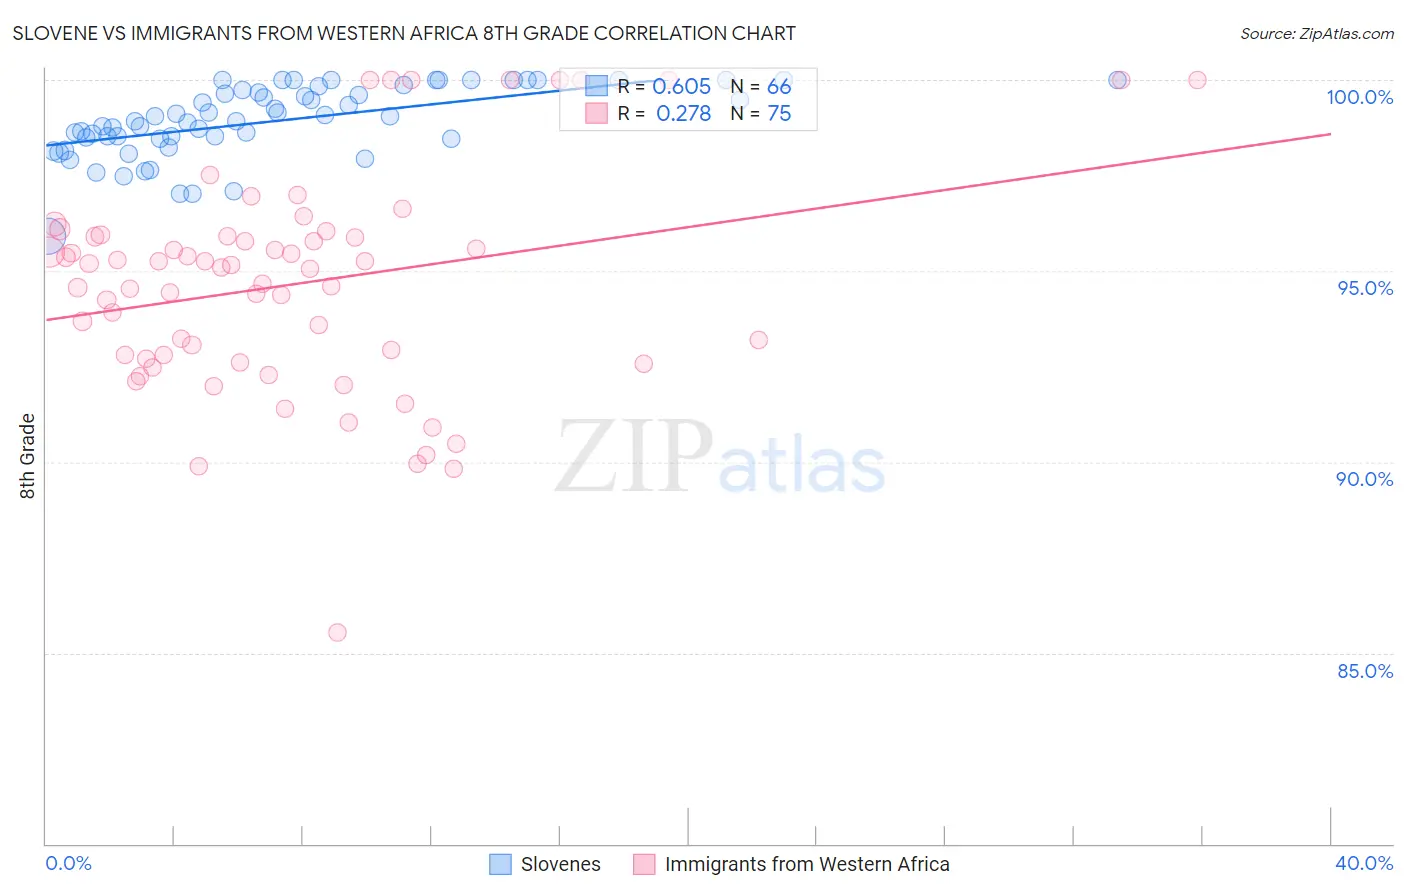
Slovene vs Immigrants from Western Africa 8th Grade Correlation Chart
The statistical analysis conducted on geographies consisting of 261,353,374 people shows a significant positive correlation between the proportion of Slovenes and percentage of population with at least 8th grade education in the United States with a correlation coefficient (R) of 0.605 and weighted average of 97.5%. Similarly, the statistical analysis conducted on geographies consisting of 357,883,667 people shows a weak positive correlation between the proportion of Immigrants from Western Africa and percentage of population with at least 8th grade education in the United States with a correlation coefficient (R) of 0.278 and weighted average of 94.8%, a difference of 2.9%.
8th Grade Correlation Summary
| Measurement | Slovene | Immigrants from Western Africa |
| Minimum | 95.9% | 85.5% |
| Maximum | 100.0% | 100.0% |
| Range | 4.1% | 14.5% |
| Mean | 98.9% | 94.7% |
| Median | 99.0% | 95.1% |
| Interquartile 25% (IQ1) | 98.5% | 92.7% |
| Interquartile 75% (IQ3) | 99.8% | 95.9% |
| Interquartile Range (IQR) | 1.3% | 3.2% |
| Standard Deviation (Sample) | 0.93% | 2.9% |
| Standard Deviation (Population) | 0.92% | 2.9% |
Similar Demographics by 8th Grade
Demographics Similar to Slovenes by 8th Grade
In terms of 8th grade, the demographic groups most similar to Slovenes are Polish (97.4%, a difference of 0.030%), Swedish (97.4%, a difference of 0.060%), German (97.5%, a difference of 0.080%), Slovak (97.6%, a difference of 0.11%), and Alaskan Athabascan (97.3%, a difference of 0.13%).
| Demographics | Rating | Rank | 8th Grade |
| Finns | 100.0 /100 | #3 | Exceptional 98.4% |
| Carpatho Rusyns | 100.0 /100 | #4 | Exceptional 98.1% |
| Ottawa | 100.0 /100 | #5 | Exceptional 97.9% |
| Dutch | 100.0 /100 | #6 | Exceptional 97.7% |
| Norwegians | 100.0 /100 | #7 | Exceptional 97.6% |
| Slovaks | 100.0 /100 | #8 | Exceptional 97.6% |
| Germans | 100.0 /100 | #9 | Exceptional 97.5% |
| Slovenes | 100.0 /100 | #10 | Exceptional 97.5% |
| Poles | 100.0 /100 | #11 | Exceptional 97.4% |
| Swedes | 100.0 /100 | #12 | Exceptional 97.4% |
| Alaskan Athabascans | 100.0 /100 | #13 | Exceptional 97.3% |
| English | 100.0 /100 | #14 | Exceptional 97.3% |
| Pennsylvania Germans | 100.0 /100 | #15 | Exceptional 97.3% |
| Tlingit-Haida | 100.0 /100 | #16 | Exceptional 97.3% |
| Irish | 100.0 /100 | #17 | Exceptional 97.3% |
Demographics Similar to Immigrants from Western Africa by 8th Grade
In terms of 8th grade, the demographic groups most similar to Immigrants from Western Africa are Immigrants from South America (94.8%, a difference of 0.0%), Immigrants from Afghanistan (94.8%, a difference of 0.010%), Trinidadian and Tobagonian (94.7%, a difference of 0.010%), Immigrants from Uzbekistan (94.8%, a difference of 0.020%), and Immigrants from Colombia (94.7%, a difference of 0.020%).
| Demographics | Rating | Rank | 8th Grade |
| West Indians | 0.3 /100 | #266 | Tragic 94.8% |
| Immigrants | Ghana | 0.3 /100 | #267 | Tragic 94.8% |
| Immigrants | Uruguay | 0.3 /100 | #268 | Tragic 94.8% |
| Immigrants | Thailand | 0.2 /100 | #269 | Tragic 94.8% |
| Immigrants | Uzbekistan | 0.2 /100 | #270 | Tragic 94.8% |
| Immigrants | Afghanistan | 0.2 /100 | #271 | Tragic 94.8% |
| Immigrants | South America | 0.2 /100 | #272 | Tragic 94.8% |
| Immigrants | Western Africa | 0.2 /100 | #273 | Tragic 94.8% |
| Trinidadians and Tobagonians | 0.2 /100 | #274 | Tragic 94.7% |
| Immigrants | Colombia | 0.2 /100 | #275 | Tragic 94.7% |
| Peruvians | 0.1 /100 | #276 | Tragic 94.7% |
| Taiwanese | 0.1 /100 | #277 | Tragic 94.7% |
| Armenians | 0.1 /100 | #278 | Tragic 94.7% |
| Immigrants | Trinidad and Tobago | 0.1 /100 | #279 | Tragic 94.6% |
| Barbadians | 0.1 /100 | #280 | Tragic 94.6% |