Slovene vs European Professional Degree
COMPARE
Slovene
European
Professional Degree
Professional Degree Comparison
Slovenes
Europeans
4.6%
PROFESSIONAL DEGREE
76.1/ 100
METRIC RATING
148th/ 347
METRIC RANK
4.8%
PROFESSIONAL DEGREE
93.2/ 100
METRIC RATING
126th/ 347
METRIC RANK
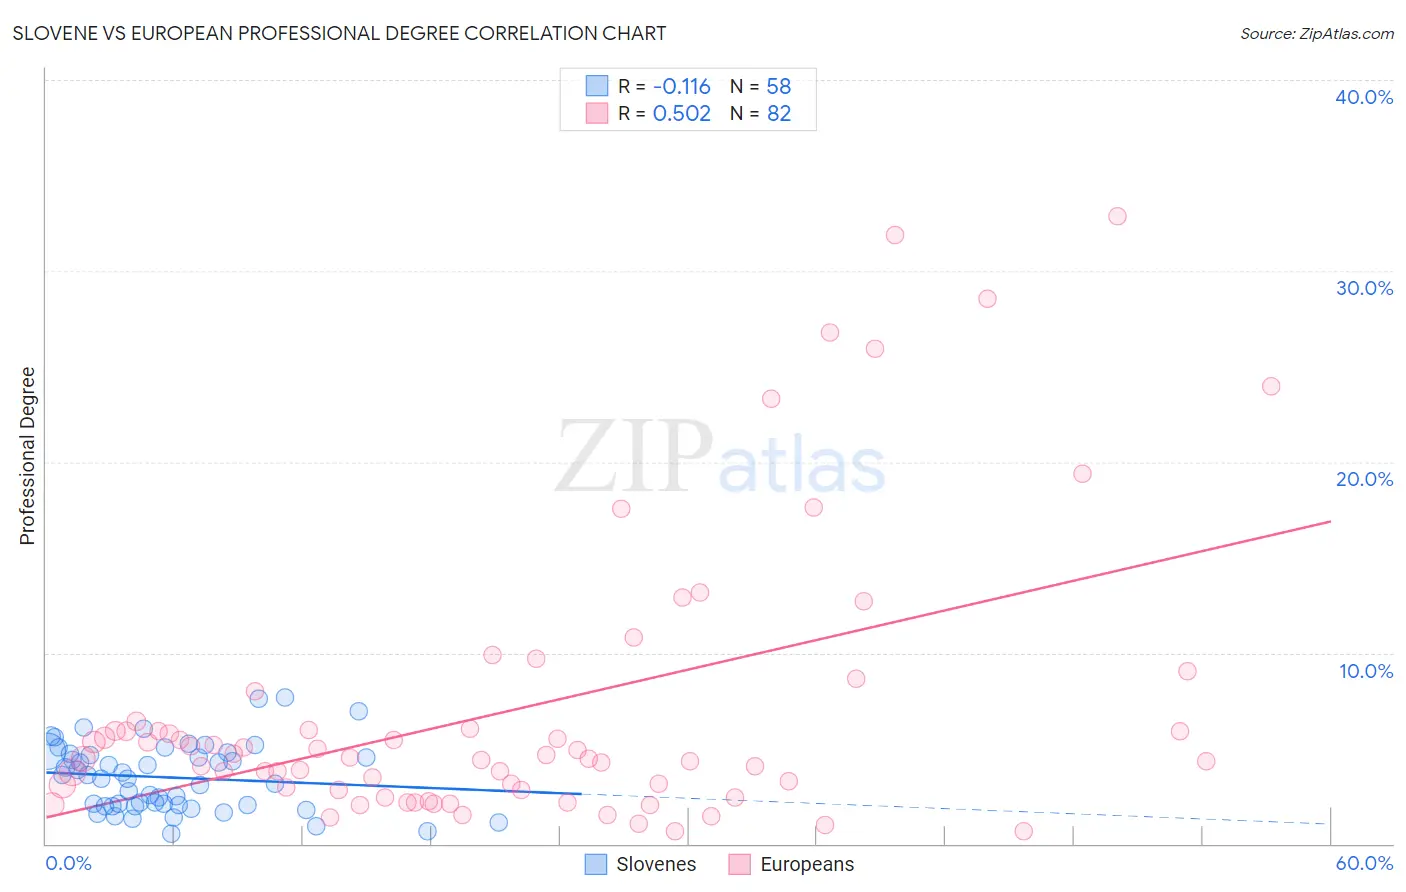
Slovene vs European Professional Degree Correlation Chart
The statistical analysis conducted on geographies consisting of 260,948,724 people shows a poor negative correlation between the proportion of Slovenes and percentage of population with at least professional degree education in the United States with a correlation coefficient (R) of -0.116 and weighted average of 4.6%. Similarly, the statistical analysis conducted on geographies consisting of 555,066,624 people shows a substantial positive correlation between the proportion of Europeans and percentage of population with at least professional degree education in the United States with a correlation coefficient (R) of 0.502 and weighted average of 4.8%, a difference of 5.1%.
Professional Degree Correlation Summary
| Measurement | Slovene | European |
| Minimum | 0.52% | 0.65% |
| Maximum | 7.7% | 32.8% |
| Range | 7.2% | 32.2% |
| Mean | 3.5% | 7.0% |
| Median | 3.5% | 4.5% |
| Interquartile 25% (IQ1) | 2.0% | 2.8% |
| Interquartile 75% (IQ3) | 4.7% | 6.0% |
| Interquartile Range (IQR) | 2.7% | 3.2% |
| Standard Deviation (Sample) | 1.7% | 7.4% |
| Standard Deviation (Population) | 1.7% | 7.3% |
Similar Demographics by Professional Degree
Demographics Similar to Slovenes by Professional Degree
In terms of professional degree, the demographic groups most similar to Slovenes are Senegalese (4.6%, a difference of 0.14%), Colombian (4.6%, a difference of 0.32%), Immigrants from Oceania (4.6%, a difference of 0.50%), Luxembourger (4.6%, a difference of 0.53%), and Polish (4.6%, a difference of 0.64%).
| Demographics | Rating | Rank | Professional Degree |
| Basques | 81.8 /100 | #141 | Excellent 4.6% |
| Sudanese | 81.3 /100 | #142 | Excellent 4.6% |
| Hungarians | 80.8 /100 | #143 | Excellent 4.6% |
| Immigrants | South America | 80.5 /100 | #144 | Excellent 4.6% |
| Uruguayans | 80.2 /100 | #145 | Excellent 4.6% |
| Luxembourgers | 78.7 /100 | #146 | Good 4.6% |
| Colombians | 77.7 /100 | #147 | Good 4.6% |
| Slovenes | 76.1 /100 | #148 | Good 4.6% |
| Senegalese | 75.3 /100 | #149 | Good 4.6% |
| Immigrants | Oceania | 73.4 /100 | #150 | Good 4.6% |
| Poles | 72.6 /100 | #151 | Good 4.6% |
| Immigrants | Africa | 72.5 /100 | #152 | Good 4.6% |
| Immigrants | Uruguay | 72.5 /100 | #153 | Good 4.6% |
| Scottish | 71.8 /100 | #154 | Good 4.6% |
| Slavs | 70.8 /100 | #155 | Good 4.5% |
Demographics Similar to Europeans by Professional Degree
In terms of professional degree, the demographic groups most similar to Europeans are Immigrants from Albania (4.8%, a difference of 0.050%), Immigrants from Eritrea (4.8%, a difference of 0.17%), Serbian (4.8%, a difference of 0.30%), Immigrants from Eastern Africa (4.8%, a difference of 0.32%), and Immigrants from Venezuela (4.8%, a difference of 0.36%).
| Demographics | Rating | Rank | Professional Degree |
| Immigrants | Sudan | 95.4 /100 | #119 | Exceptional 4.9% |
| Albanians | 95.3 /100 | #120 | Exceptional 4.9% |
| Immigrants | Moldova | 94.8 /100 | #121 | Exceptional 4.9% |
| Immigrants | Germany | 94.1 /100 | #122 | Exceptional 4.9% |
| Immigrants | Venezuela | 93.8 /100 | #123 | Exceptional 4.8% |
| Immigrants | Eritrea | 93.5 /100 | #124 | Exceptional 4.8% |
| Immigrants | Albania | 93.3 /100 | #125 | Exceptional 4.8% |
| Europeans | 93.2 /100 | #126 | Exceptional 4.8% |
| Serbians | 92.6 /100 | #127 | Exceptional 4.8% |
| Immigrants | Eastern Africa | 92.5 /100 | #128 | Exceptional 4.8% |
| Palestinians | 91.5 /100 | #129 | Exceptional 4.8% |
| Icelanders | 91.5 /100 | #130 | Exceptional 4.8% |
| Immigrants | Nepal | 91.4 /100 | #131 | Exceptional 4.8% |
| Pakistanis | 90.9 /100 | #132 | Exceptional 4.8% |
| Italians | 90.2 /100 | #133 | Exceptional 4.8% |