Slovak vs Immigrants from China 8th Grade
COMPARE
Slovak
Immigrants from China
8th Grade
8th Grade Comparison
Slovaks
Immigrants from China
97.6%
8TH GRADE
100.0/ 100
METRIC RATING
8th/ 347
METRIC RANK
95.0%
8TH GRADE
1.1/ 100
METRIC RATING
249th/ 347
METRIC RANK
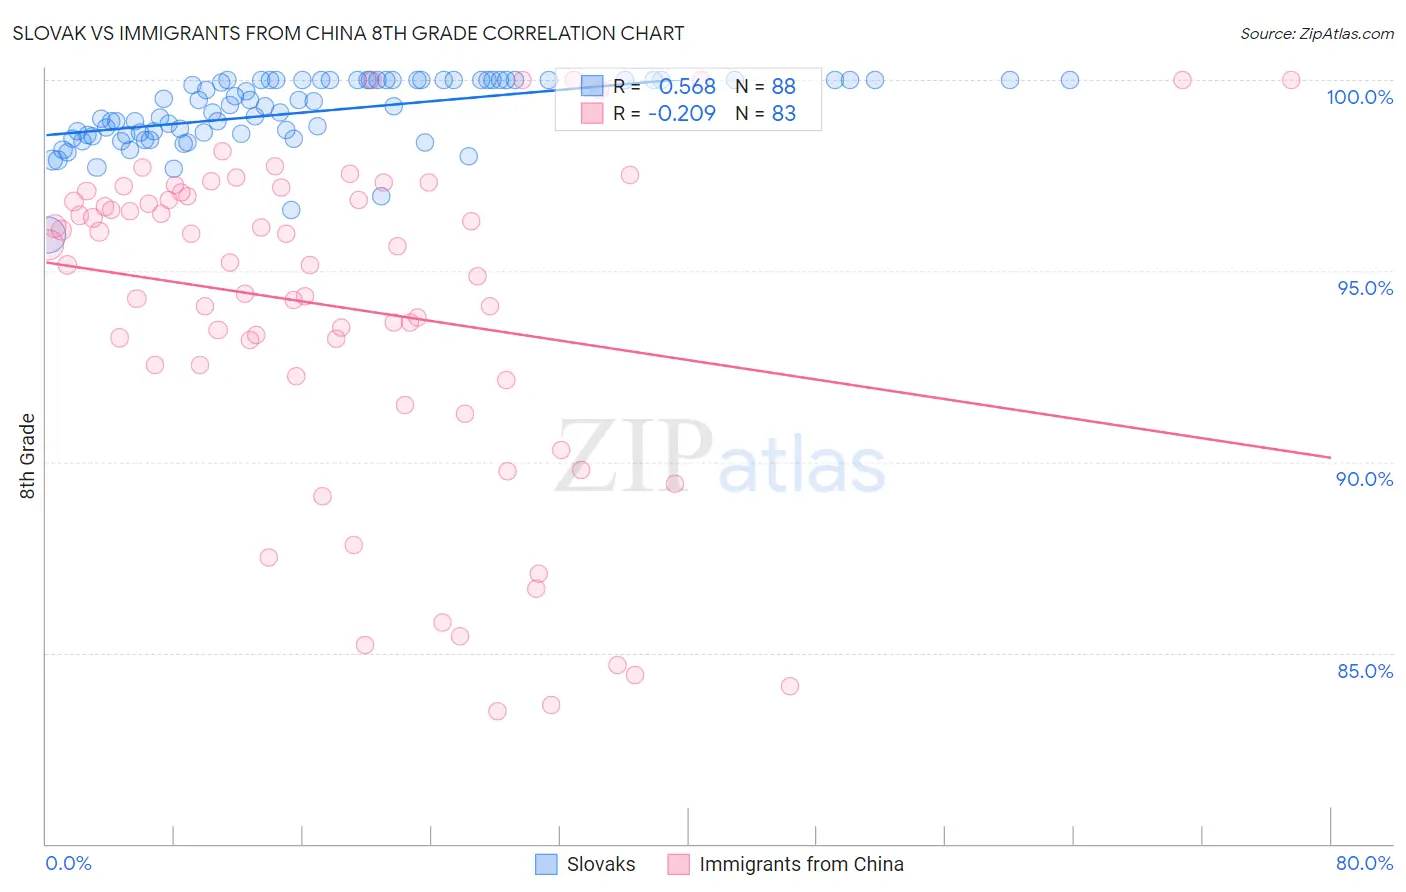
Slovak vs Immigrants from China 8th Grade Correlation Chart
The statistical analysis conducted on geographies consisting of 397,890,986 people shows a substantial positive correlation between the proportion of Slovaks and percentage of population with at least 8th grade education in the United States with a correlation coefficient (R) of 0.568 and weighted average of 97.6%. Similarly, the statistical analysis conducted on geographies consisting of 457,082,957 people shows a weak negative correlation between the proportion of Immigrants from China and percentage of population with at least 8th grade education in the United States with a correlation coefficient (R) of -0.209 and weighted average of 95.0%, a difference of 2.7%.
8th Grade Correlation Summary
| Measurement | Slovak | Immigrants from China |
| Minimum | 95.9% | 83.5% |
| Maximum | 100.0% | 100.0% |
| Range | 4.1% | 16.5% |
| Mean | 99.2% | 94.0% |
| Median | 99.3% | 95.2% |
| Interquartile 25% (IQ1) | 98.5% | 92.3% |
| Interquartile 75% (IQ3) | 100.0% | 97.0% |
| Interquartile Range (IQR) | 1.5% | 4.8% |
| Standard Deviation (Sample) | 0.89% | 4.4% |
| Standard Deviation (Population) | 0.88% | 4.3% |
Similar Demographics by 8th Grade
Demographics Similar to Slovaks by 8th Grade
In terms of 8th grade, the demographic groups most similar to Slovaks are German (97.5%, a difference of 0.030%), Norwegian (97.6%, a difference of 0.040%), Dutch (97.7%, a difference of 0.10%), Slovene (97.5%, a difference of 0.11%), and Polish (97.4%, a difference of 0.14%).
| Demographics | Rating | Rank | 8th Grade |
| Crow | 100.0 /100 | #1 | Exceptional 99.0% |
| Tsimshian | 100.0 /100 | #2 | Exceptional 99.0% |
| Finns | 100.0 /100 | #3 | Exceptional 98.4% |
| Carpatho Rusyns | 100.0 /100 | #4 | Exceptional 98.1% |
| Ottawa | 100.0 /100 | #5 | Exceptional 97.9% |
| Dutch | 100.0 /100 | #6 | Exceptional 97.7% |
| Norwegians | 100.0 /100 | #7 | Exceptional 97.6% |
| Slovaks | 100.0 /100 | #8 | Exceptional 97.6% |
| Germans | 100.0 /100 | #9 | Exceptional 97.5% |
| Slovenes | 100.0 /100 | #10 | Exceptional 97.5% |
| Poles | 100.0 /100 | #11 | Exceptional 97.4% |
| Swedes | 100.0 /100 | #12 | Exceptional 97.4% |
| Alaskan Athabascans | 100.0 /100 | #13 | Exceptional 97.3% |
| English | 100.0 /100 | #14 | Exceptional 97.3% |
| Pennsylvania Germans | 100.0 /100 | #15 | Exceptional 97.3% |
Demographics Similar to Immigrants from China by 8th Grade
In terms of 8th grade, the demographic groups most similar to Immigrants from China are Korean (95.0%, a difference of 0.0%), Bolivian (95.0%, a difference of 0.010%), Uruguayan (95.1%, a difference of 0.020%), Immigrants from Ethiopia (95.0%, a difference of 0.020%), and U.S. Virgin Islander (95.0%, a difference of 0.030%).
| Demographics | Rating | Rank | 8th Grade |
| Tongans | 1.7 /100 | #242 | Tragic 95.1% |
| Paiute | 1.7 /100 | #243 | Tragic 95.1% |
| Immigrants | Middle Africa | 1.7 /100 | #244 | Tragic 95.1% |
| Jamaicans | 1.4 /100 | #245 | Tragic 95.1% |
| Somalis | 1.4 /100 | #246 | Tragic 95.1% |
| Immigrants | Senegal | 1.4 /100 | #247 | Tragic 95.1% |
| Uruguayans | 1.2 /100 | #248 | Tragic 95.1% |
| Immigrants | China | 1.1 /100 | #249 | Tragic 95.0% |
| Koreans | 1.1 /100 | #250 | Tragic 95.0% |
| Bolivians | 1.0 /100 | #251 | Tragic 95.0% |
| Immigrants | Ethiopia | 1.0 /100 | #252 | Tragic 95.0% |
| U.S. Virgin Islanders | 0.9 /100 | #253 | Tragic 95.0% |
| Immigrants | Cameroon | 0.8 /100 | #254 | Tragic 95.0% |
| Immigrants | Somalia | 0.7 /100 | #255 | Tragic 95.0% |
| Colombians | 0.7 /100 | #256 | Tragic 95.0% |