Slovak vs Dutch West Indian 1st Grade
COMPARE
Slovak
Dutch West Indian
1st Grade
1st Grade Comparison
Slovaks
Dutch West Indians
98.7%
1ST GRADE
100.0/ 100
METRIC RATING
9th/ 347
METRIC RANK
98.0%
1ST GRADE
69.8/ 100
METRIC RATING
151st/ 347
METRIC RANK
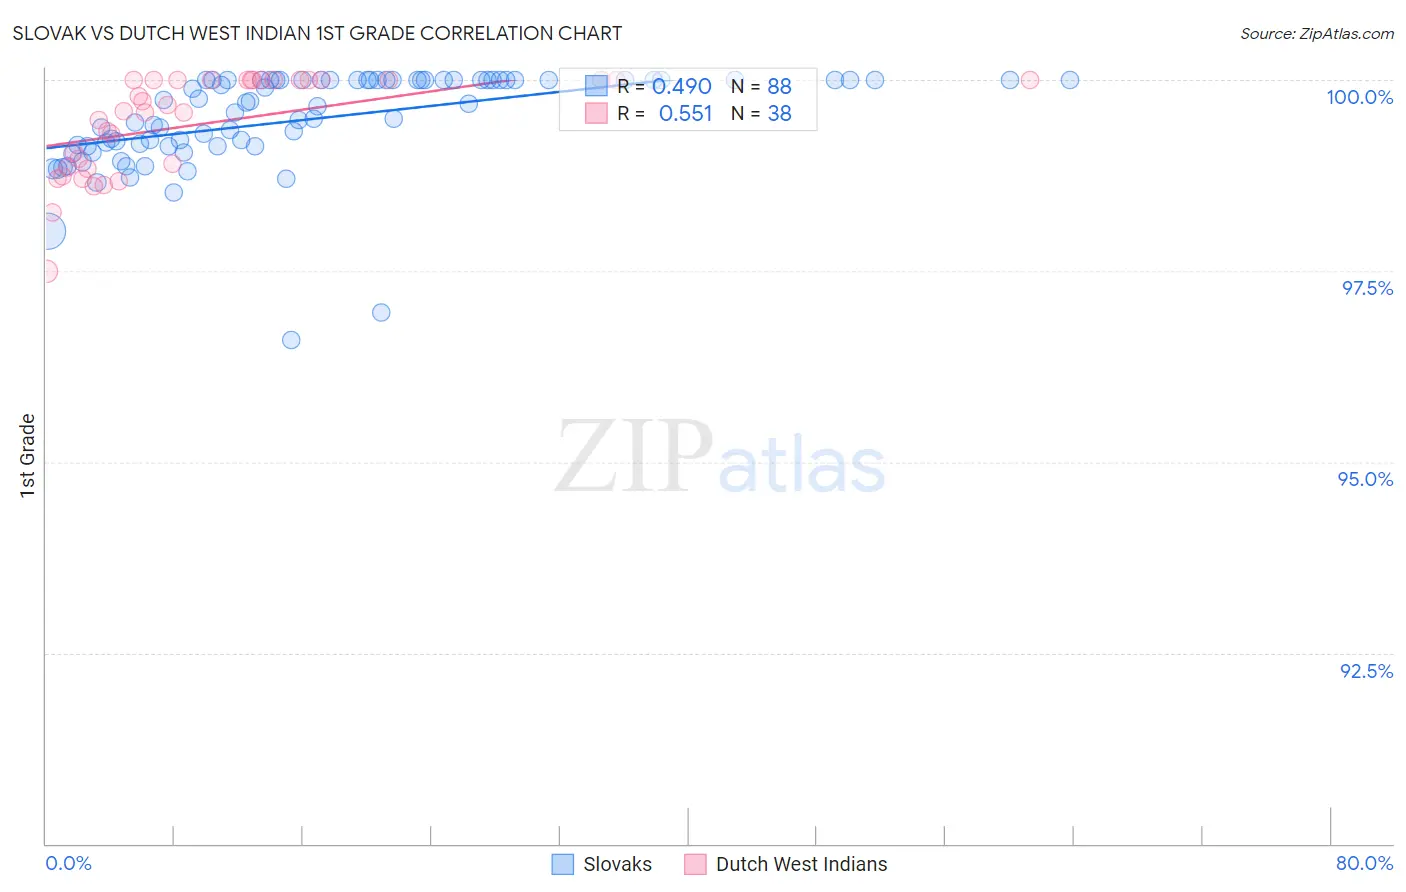
Slovak vs Dutch West Indian 1st Grade Correlation Chart
The statistical analysis conducted on geographies consisting of 397,890,986 people shows a moderate positive correlation between the proportion of Slovaks and percentage of population with at least 1st grade education in the United States with a correlation coefficient (R) of 0.490 and weighted average of 98.7%. Similarly, the statistical analysis conducted on geographies consisting of 85,776,075 people shows a substantial positive correlation between the proportion of Dutch West Indians and percentage of population with at least 1st grade education in the United States with a correlation coefficient (R) of 0.551 and weighted average of 98.0%, a difference of 0.72%.
1st Grade Correlation Summary
| Measurement | Slovak | Dutch West Indian |
| Minimum | 96.6% | 97.5% |
| Maximum | 100.0% | 100.0% |
| Range | 3.4% | 2.5% |
| Mean | 99.5% | 99.4% |
| Median | 99.7% | 99.6% |
| Interquartile 25% (IQ1) | 99.1% | 98.9% |
| Interquartile 75% (IQ3) | 100.0% | 100.0% |
| Interquartile Range (IQR) | 0.86% | 1.1% |
| Standard Deviation (Sample) | 0.64% | 0.65% |
| Standard Deviation (Population) | 0.64% | 0.64% |
Similar Demographics by 1st Grade
Demographics Similar to Slovaks by 1st Grade
In terms of 1st grade, the demographic groups most similar to Slovaks are German (98.7%, a difference of 0.0%), Norwegian (98.7%, a difference of 0.020%), Tlingit-Haida (98.7%, a difference of 0.020%), Slovene (98.7%, a difference of 0.030%), and Alaska Native (98.7%, a difference of 0.040%).
| Demographics | Rating | Rank | 1st Grade |
| Yup'ik | 100.0 /100 | #2 | Exceptional 99.2% |
| Inupiat | 100.0 /100 | #3 | Exceptional 98.9% |
| Welsh | 100.0 /100 | #4 | Exceptional 98.9% |
| Tsimshian | 100.0 /100 | #5 | Exceptional 98.8% |
| Alaskan Athabascans | 100.0 /100 | #6 | Exceptional 98.8% |
| Alaska Natives | 100.0 /100 | #7 | Exceptional 98.7% |
| Norwegians | 100.0 /100 | #8 | Exceptional 98.7% |
| Slovaks | 100.0 /100 | #9 | Exceptional 98.7% |
| Germans | 100.0 /100 | #10 | Exceptional 98.7% |
| Tlingit-Haida | 100.0 /100 | #11 | Exceptional 98.7% |
| Slovenes | 100.0 /100 | #12 | Exceptional 98.7% |
| Carpatho Rusyns | 100.0 /100 | #13 | Exceptional 98.6% |
| English | 100.0 /100 | #14 | Exceptional 98.6% |
| Swedes | 100.0 /100 | #15 | Exceptional 98.6% |
| Aleuts | 100.0 /100 | #16 | Exceptional 98.6% |
Demographics Similar to Dutch West Indians by 1st Grade
In terms of 1st grade, the demographic groups most similar to Dutch West Indians are Immigrants from Moldova (98.0%, a difference of 0.0%), Soviet Union (98.0%, a difference of 0.0%), Jordanian (98.0%, a difference of 0.010%), Immigrants from Iran (98.0%, a difference of 0.010%), and Comanche (98.0%, a difference of 0.010%).
| Demographics | Rating | Rank | 1st Grade |
| Alsatians | 80.9 /100 | #144 | Excellent 98.0% |
| Hmong | 79.0 /100 | #145 | Good 98.0% |
| Immigrants | Israel | 77.8 /100 | #146 | Good 98.0% |
| Filipinos | 77.6 /100 | #147 | Good 98.0% |
| Apache | 75.2 /100 | #148 | Good 98.0% |
| Immigrants | Greece | 74.9 /100 | #149 | Good 98.0% |
| Jordanians | 72.7 /100 | #150 | Good 98.0% |
| Dutch West Indians | 69.8 /100 | #151 | Good 98.0% |
| Immigrants | Moldova | 69.5 /100 | #152 | Good 98.0% |
| Soviet Union | 68.9 /100 | #153 | Good 98.0% |
| Immigrants | Iran | 66.9 /100 | #154 | Good 98.0% |
| Comanche | 66.9 /100 | #155 | Good 98.0% |
| Immigrants | South Central Asia | 66.2 /100 | #156 | Good 98.0% |
| Immigrants | North Macedonia | 65.3 /100 | #157 | Good 98.0% |
| Venezuelans | 64.7 /100 | #158 | Good 98.0% |