Slavic vs Immigrants from Yemen 11th Grade
COMPARE
Slavic
Immigrants from Yemen
11th Grade
11th Grade Comparison
Slavs
Immigrants from Yemen
94.1%
11TH GRADE
99.9/ 100
METRIC RATING
49th/ 347
METRIC RANK
87.1%
11TH GRADE
0.0/ 100
METRIC RATING
333rd/ 347
METRIC RANK
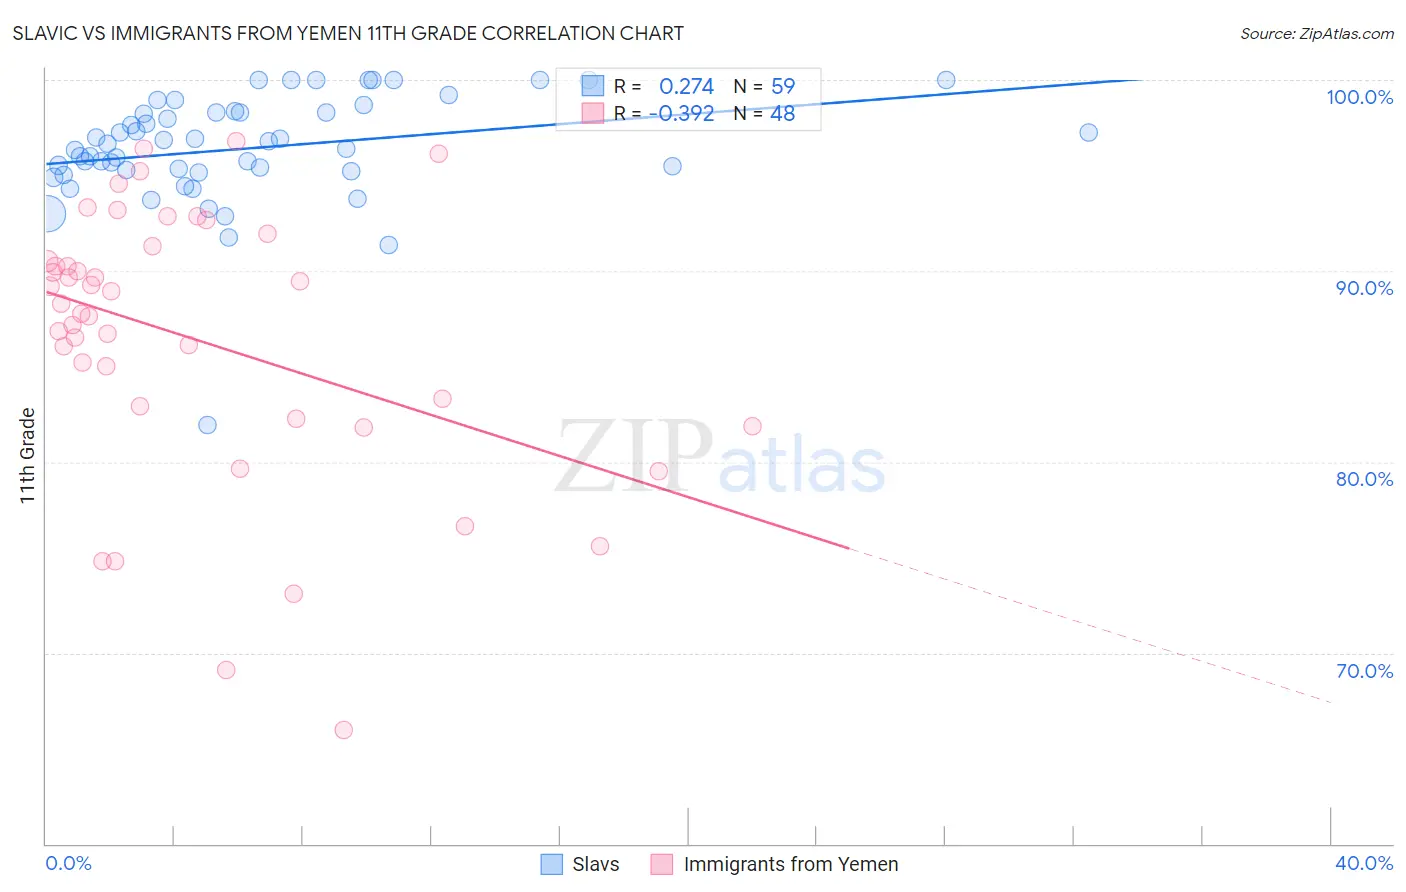
Slavic vs Immigrants from Yemen 11th Grade Correlation Chart
The statistical analysis conducted on geographies consisting of 270,868,354 people shows a weak positive correlation between the proportion of Slavs and percentage of population with at least 11th grade education in the United States with a correlation coefficient (R) of 0.274 and weighted average of 94.1%. Similarly, the statistical analysis conducted on geographies consisting of 82,421,120 people shows a mild negative correlation between the proportion of Immigrants from Yemen and percentage of population with at least 11th grade education in the United States with a correlation coefficient (R) of -0.392 and weighted average of 87.1%, a difference of 8.0%.
11th Grade Correlation Summary
| Measurement | Slavic | Immigrants from Yemen |
| Minimum | 81.9% | 66.0% |
| Maximum | 100.0% | 96.8% |
| Range | 18.1% | 30.8% |
| Mean | 96.4% | 86.4% |
| Median | 96.7% | 88.0% |
| Interquartile 25% (IQ1) | 95.2% | 82.6% |
| Interquartile 75% (IQ3) | 98.3% | 90.9% |
| Interquartile Range (IQR) | 3.1% | 8.3% |
| Standard Deviation (Sample) | 2.9% | 7.2% |
| Standard Deviation (Population) | 2.9% | 7.1% |
Similar Demographics by 11th Grade
Demographics Similar to Slavs by 11th Grade
In terms of 11th grade, the demographic groups most similar to Slavs are Filipino (94.1%, a difference of 0.0%), Macedonian (94.1%, a difference of 0.0%), French (94.1%, a difference of 0.0%), Serbian (94.1%, a difference of 0.010%), and Australian (94.1%, a difference of 0.020%).
| Demographics | Rating | Rank | 11th Grade |
| Immigrants | Austria | 99.9 /100 | #42 | Exceptional 94.1% |
| Greeks | 99.9 /100 | #43 | Exceptional 94.1% |
| Immigrants | Ireland | 99.9 /100 | #44 | Exceptional 94.1% |
| Australians | 99.9 /100 | #45 | Exceptional 94.1% |
| Serbians | 99.9 /100 | #46 | Exceptional 94.1% |
| Filipinos | 99.9 /100 | #47 | Exceptional 94.1% |
| Macedonians | 99.9 /100 | #48 | Exceptional 94.1% |
| Slavs | 99.9 /100 | #49 | Exceptional 94.1% |
| French | 99.9 /100 | #50 | Exceptional 94.1% |
| Turks | 99.9 /100 | #51 | Exceptional 94.0% |
| Immigrants | Canada | 99.9 /100 | #52 | Exceptional 94.0% |
| Immigrants | Australia | 99.9 /100 | #53 | Exceptional 94.0% |
| Immigrants | North America | 99.9 /100 | #54 | Exceptional 94.0% |
| Czechoslovakians | 99.9 /100 | #55 | Exceptional 94.0% |
| French Canadians | 99.9 /100 | #56 | Exceptional 94.0% |
Demographics Similar to Immigrants from Yemen by 11th Grade
In terms of 11th grade, the demographic groups most similar to Immigrants from Yemen are Houma (87.0%, a difference of 0.060%), Central American (86.9%, a difference of 0.16%), Immigrants from the Azores (87.2%, a difference of 0.17%), Immigrants from Dominican Republic (86.9%, a difference of 0.20%), and Immigrants from Honduras (86.9%, a difference of 0.21%).
| Demographics | Rating | Rank | 11th Grade |
| Dominicans | 0.0 /100 | #326 | Tragic 87.7% |
| Immigrants | Cabo Verde | 0.0 /100 | #327 | Tragic 87.6% |
| Tohono O'odham | 0.0 /100 | #328 | Tragic 87.6% |
| Mexican American Indians | 0.0 /100 | #329 | Tragic 87.5% |
| Hondurans | 0.0 /100 | #330 | Tragic 87.4% |
| Hispanics or Latinos | 0.0 /100 | #331 | Tragic 87.3% |
| Immigrants | Azores | 0.0 /100 | #332 | Tragic 87.2% |
| Immigrants | Yemen | 0.0 /100 | #333 | Tragic 87.1% |
| Houma | 0.0 /100 | #334 | Tragic 87.0% |
| Central Americans | 0.0 /100 | #335 | Tragic 86.9% |
| Immigrants | Dominican Republic | 0.0 /100 | #336 | Tragic 86.9% |
| Immigrants | Honduras | 0.0 /100 | #337 | Tragic 86.9% |
| Immigrants | Latin America | 0.0 /100 | #338 | Tragic 86.8% |
| Guatemalans | 0.0 /100 | #339 | Tragic 86.4% |
| Salvadorans | 0.0 /100 | #340 | Tragic 86.2% |