Slavic vs Immigrants from Mexico Associate's Degree
COMPARE
Slavic
Immigrants from Mexico
Associate's Degree
Associate's Degree Comparison
Slavs
Immigrants from Mexico
47.6%
ASSOCIATE'S DEGREE
80.5/ 100
METRIC RATING
144th/ 347
METRIC RANK
33.7%
ASSOCIATE'S DEGREE
0.0/ 100
METRIC RATING
339th/ 347
METRIC RANK
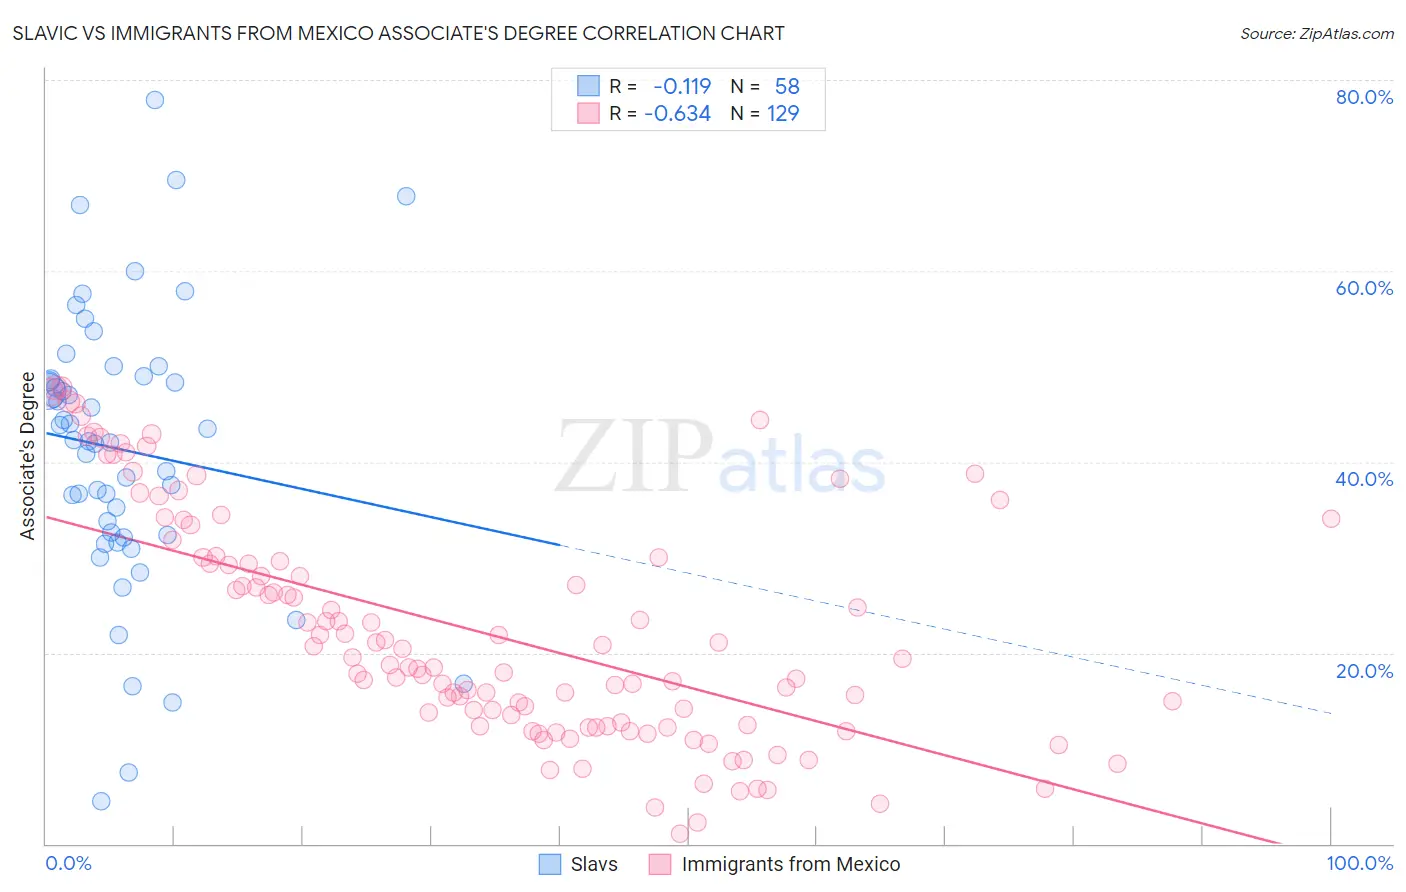
Slavic vs Immigrants from Mexico Associate's Degree Correlation Chart
The statistical analysis conducted on geographies consisting of 270,857,776 people shows a poor negative correlation between the proportion of Slavs and percentage of population with at least associate's degree education in the United States with a correlation coefficient (R) of -0.119 and weighted average of 47.6%. Similarly, the statistical analysis conducted on geographies consisting of 513,696,762 people shows a significant negative correlation between the proportion of Immigrants from Mexico and percentage of population with at least associate's degree education in the United States with a correlation coefficient (R) of -0.634 and weighted average of 33.7%, a difference of 41.1%.
Associate's Degree Correlation Summary
| Measurement | Slavic | Immigrants from Mexico |
| Minimum | 4.4% | 0.99% |
| Maximum | 77.9% | 47.9% |
| Range | 73.5% | 46.9% |
| Mean | 41.3% | 22.3% |
| Median | 42.2% | 19.4% |
| Interquartile 25% (IQ1) | 32.4% | 12.4% |
| Interquartile 75% (IQ3) | 48.7% | 30.0% |
| Interquartile Range (IQR) | 16.3% | 17.6% |
| Standard Deviation (Sample) | 14.5% | 12.0% |
| Standard Deviation (Population) | 14.4% | 11.9% |
Similar Demographics by Associate's Degree
Demographics Similar to Slavs by Associate's Degree
In terms of associate's degree, the demographic groups most similar to Slavs are Norwegian (47.6%, a difference of 0.060%), Canadian (47.5%, a difference of 0.17%), Sierra Leonean (47.7%, a difference of 0.29%), Immigrants from Sudan (47.4%, a difference of 0.30%), and Taiwanese (47.7%, a difference of 0.34%).
| Demographics | Rating | Rank | Associate's Degree |
| Immigrants | Eritrea | 87.8 /100 | #137 | Excellent 48.1% |
| Poles | 87.3 /100 | #138 | Excellent 48.0% |
| Slovenes | 85.1 /100 | #139 | Excellent 47.9% |
| Immigrants | Southern Europe | 84.4 /100 | #140 | Excellent 47.8% |
| Taiwanese | 83.3 /100 | #141 | Excellent 47.7% |
| Sierra Leoneans | 82.9 /100 | #142 | Excellent 47.7% |
| Norwegians | 81.0 /100 | #143 | Excellent 47.6% |
| Slavs | 80.5 /100 | #144 | Excellent 47.6% |
| Canadians | 79.0 /100 | #145 | Good 47.5% |
| Immigrants | Sudan | 77.9 /100 | #146 | Good 47.4% |
| Danes | 77.3 /100 | #147 | Good 47.4% |
| South American Indians | 76.7 /100 | #148 | Good 47.4% |
| Immigrants | Armenia | 76.6 /100 | #149 | Good 47.4% |
| Iraqis | 76.2 /100 | #150 | Good 47.4% |
| Immigrants | North Macedonia | 76.0 /100 | #151 | Good 47.4% |
Demographics Similar to Immigrants from Mexico by Associate's Degree
In terms of associate's degree, the demographic groups most similar to Immigrants from Mexico are Pueblo (34.0%, a difference of 0.71%), Lumbee (34.1%, a difference of 1.1%), Hopi (34.6%, a difference of 2.4%), Spanish American Indian (34.9%, a difference of 3.3%), and Native/Alaskan (34.9%, a difference of 3.5%).
| Demographics | Rating | Rank | Associate's Degree |
| Immigrants | Central America | 0.0 /100 | #332 | Tragic 35.0% |
| Mexicans | 0.0 /100 | #333 | Tragic 35.0% |
| Natives/Alaskans | 0.0 /100 | #334 | Tragic 34.9% |
| Spanish American Indians | 0.0 /100 | #335 | Tragic 34.9% |
| Hopi | 0.0 /100 | #336 | Tragic 34.6% |
| Lumbee | 0.0 /100 | #337 | Tragic 34.1% |
| Pueblo | 0.0 /100 | #338 | Tragic 34.0% |
| Immigrants | Mexico | 0.0 /100 | #339 | Tragic 33.7% |
| Navajo | 0.0 /100 | #340 | Tragic 32.6% |
| Inupiat | 0.0 /100 | #341 | Tragic 32.6% |
| Yakama | 0.0 /100 | #342 | Tragic 32.3% |
| Tohono O'odham | 0.0 /100 | #343 | Tragic 31.8% |
| Yuman | 0.0 /100 | #344 | Tragic 31.3% |
| Pima | 0.0 /100 | #345 | Tragic 30.2% |
| Houma | 0.0 /100 | #346 | Tragic 28.2% |