Slavic vs Immigrants from Denmark 7th Grade
COMPARE
Slavic
Immigrants from Denmark
7th Grade
7th Grade Comparison
Slavs
Immigrants from Denmark
97.1%
7TH GRADE
99.9/ 100
METRIC RATING
49th/ 347
METRIC RANK
96.7%
7TH GRADE
98.7/ 100
METRIC RATING
96th/ 347
METRIC RANK
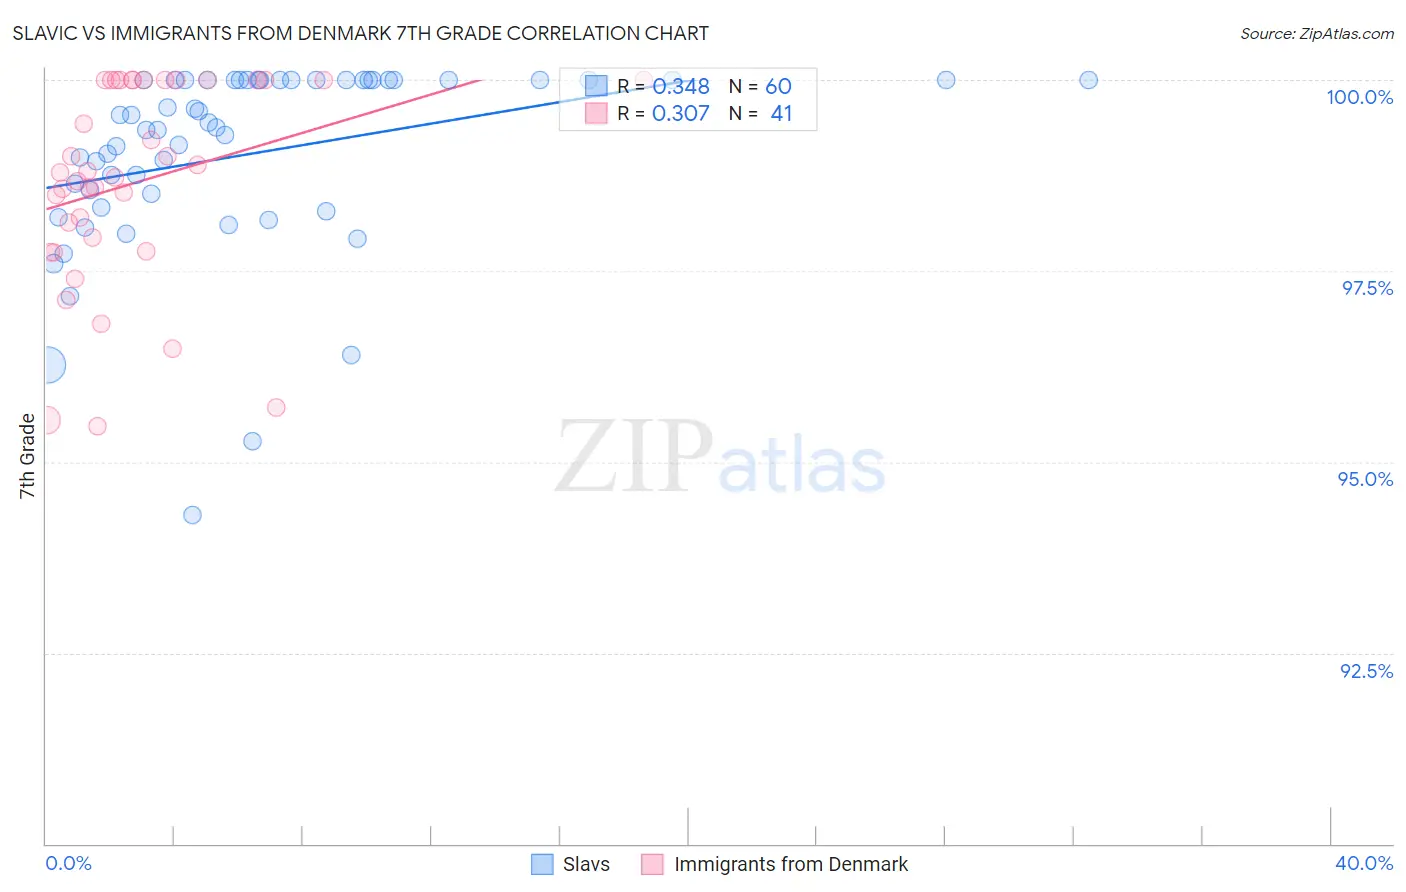
Slavic vs Immigrants from Denmark 7th Grade Correlation Chart
The statistical analysis conducted on geographies consisting of 270,869,056 people shows a mild positive correlation between the proportion of Slavs and percentage of population with at least 7th grade education in the United States with a correlation coefficient (R) of 0.348 and weighted average of 97.1%. Similarly, the statistical analysis conducted on geographies consisting of 136,430,932 people shows a mild positive correlation between the proportion of Immigrants from Denmark and percentage of population with at least 7th grade education in the United States with a correlation coefficient (R) of 0.307 and weighted average of 96.7%, a difference of 0.39%.
7th Grade Correlation Summary
| Measurement | Slavic | Immigrants from Denmark |
| Minimum | 94.3% | 95.5% |
| Maximum | 100.0% | 100.0% |
| Range | 5.7% | 4.5% |
| Mean | 99.0% | 98.7% |
| Median | 99.4% | 98.8% |
| Interquartile 25% (IQ1) | 98.4% | 97.9% |
| Interquartile 75% (IQ3) | 100.0% | 100.0% |
| Interquartile Range (IQR) | 1.6% | 2.1% |
| Standard Deviation (Sample) | 1.2% | 1.3% |
| Standard Deviation (Population) | 1.2% | 1.3% |
Similar Demographics by 7th Grade
Demographics Similar to Slavs by 7th Grade
In terms of 7th grade, the demographic groups most similar to Slavs are Immigrants from Scotland (97.1%, a difference of 0.0%), Bulgarian (97.1%, a difference of 0.010%), Celtic (97.1%, a difference of 0.010%), Estonian (97.0%, a difference of 0.030%), and Czechoslovakian (97.1%, a difference of 0.040%).
| Demographics | Rating | Rank | 7th Grade |
| Chinese | 99.9 /100 | #42 | Exceptional 97.1% |
| Maltese | 99.9 /100 | #43 | Exceptional 97.1% |
| Northern Europeans | 99.9 /100 | #44 | Exceptional 97.1% |
| Czechoslovakians | 99.9 /100 | #45 | Exceptional 97.1% |
| Aleuts | 99.9 /100 | #46 | Exceptional 97.1% |
| Bulgarians | 99.9 /100 | #47 | Exceptional 97.1% |
| Celtics | 99.9 /100 | #48 | Exceptional 97.1% |
| Slavs | 99.9 /100 | #49 | Exceptional 97.1% |
| Immigrants | Scotland | 99.9 /100 | #50 | Exceptional 97.1% |
| Estonians | 99.9 /100 | #51 | Exceptional 97.0% |
| Greeks | 99.9 /100 | #52 | Exceptional 97.0% |
| Austrians | 99.8 /100 | #53 | Exceptional 97.0% |
| Australians | 99.8 /100 | #54 | Exceptional 97.0% |
| Russians | 99.8 /100 | #55 | Exceptional 97.0% |
| Serbians | 99.8 /100 | #56 | Exceptional 97.0% |
Demographics Similar to Immigrants from Denmark by 7th Grade
In terms of 7th grade, the demographic groups most similar to Immigrants from Denmark are Immigrants from Germany (96.7%, a difference of 0.0%), Immigrants from Sweden (96.7%, a difference of 0.0%), Menominee (96.7%, a difference of 0.0%), Lebanese (96.7%, a difference of 0.010%), and Immigrants from Australia (96.7%, a difference of 0.010%).
| Demographics | Rating | Rank | 7th Grade |
| Cree | 99.0 /100 | #89 | Exceptional 96.7% |
| Immigrants | South Africa | 98.9 /100 | #90 | Exceptional 96.7% |
| Osage | 98.9 /100 | #91 | Exceptional 96.7% |
| Immigrants | Western Europe | 98.9 /100 | #92 | Exceptional 96.7% |
| Potawatomi | 98.9 /100 | #93 | Exceptional 96.7% |
| Lebanese | 98.8 /100 | #94 | Exceptional 96.7% |
| Immigrants | Australia | 98.8 /100 | #95 | Exceptional 96.7% |
| Immigrants | Denmark | 98.7 /100 | #96 | Exceptional 96.7% |
| Immigrants | Germany | 98.7 /100 | #97 | Exceptional 96.7% |
| Immigrants | Sweden | 98.7 /100 | #98 | Exceptional 96.7% |
| Menominee | 98.7 /100 | #99 | Exceptional 96.7% |
| German Russians | 98.6 /100 | #100 | Exceptional 96.7% |
| Thais | 98.6 /100 | #101 | Exceptional 96.7% |
| Immigrants | Czechoslovakia | 98.3 /100 | #102 | Exceptional 96.6% |
| Immigrants | Singapore | 98.3 /100 | #103 | Exceptional 96.6% |