Sioux vs Uruguayan Doctorate Degree
COMPARE
Sioux
Uruguayan
Doctorate Degree
Doctorate Degree Comparison
Sioux
Uruguayans
1.5%
DOCTORATE DEGREE
0.4/ 100
METRIC RATING
273rd/ 347
METRIC RANK
1.8%
DOCTORATE DEGREE
26.2/ 100
METRIC RATING
194th/ 347
METRIC RANK
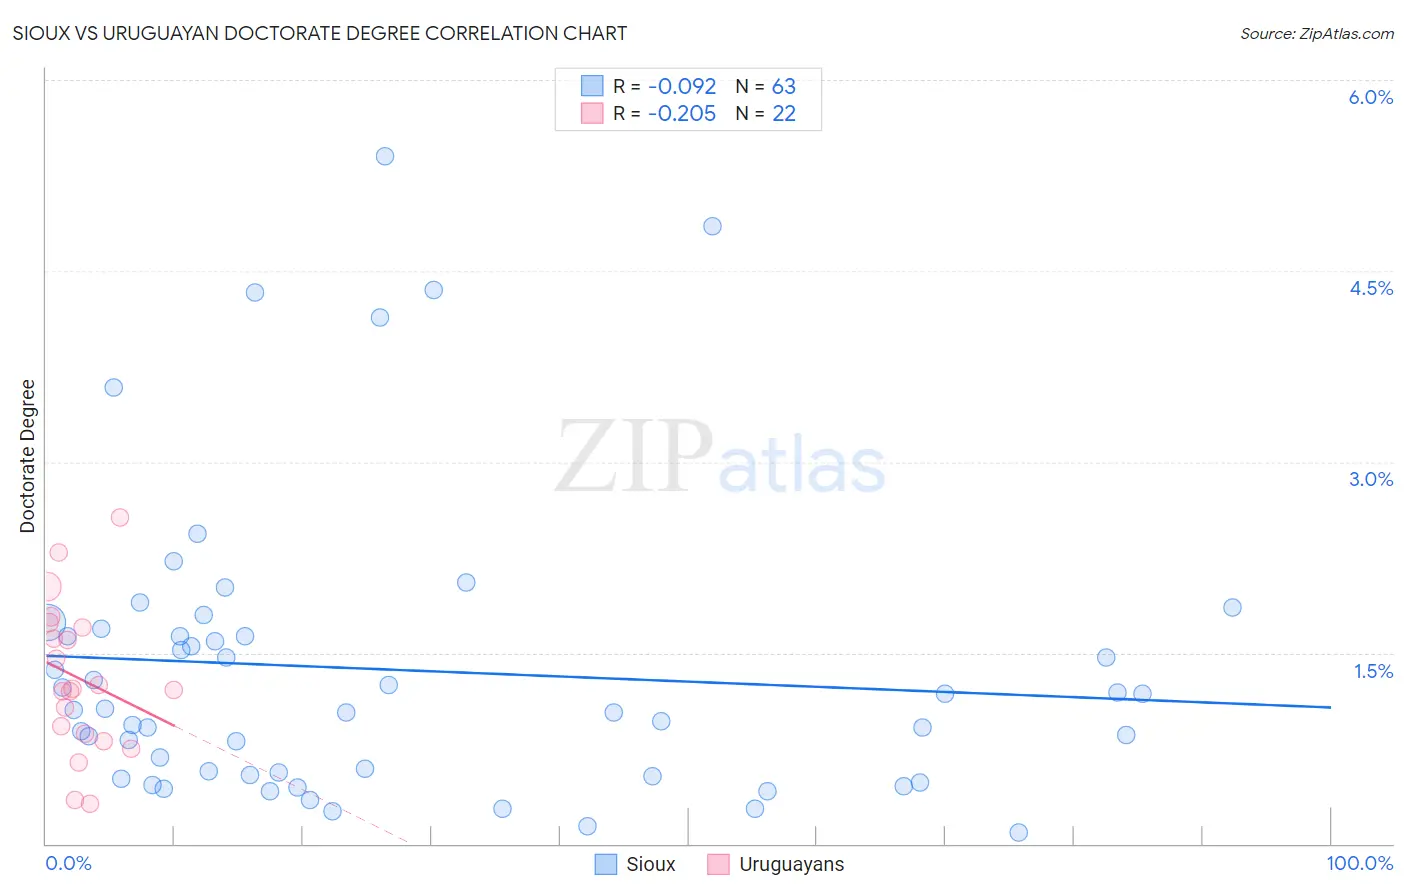
Sioux vs Uruguayan Doctorate Degree Correlation Chart
The statistical analysis conducted on geographies consisting of 231,042,673 people shows a slight negative correlation between the proportion of Sioux and percentage of population with at least doctorate degree education in the United States with a correlation coefficient (R) of -0.092 and weighted average of 1.5%. Similarly, the statistical analysis conducted on geographies consisting of 144,575,670 people shows a weak negative correlation between the proportion of Uruguayans and percentage of population with at least doctorate degree education in the United States with a correlation coefficient (R) of -0.205 and weighted average of 1.8%, a difference of 20.1%.
Doctorate Degree Correlation Summary
| Measurement | Sioux | Uruguayan |
| Minimum | 0.086% | 0.31% |
| Maximum | 5.4% | 2.6% |
| Range | 5.3% | 2.2% |
| Mean | 1.4% | 1.3% |
| Median | 1.1% | 1.2% |
| Interquartile 25% (IQ1) | 0.54% | 0.86% |
| Interquartile 75% (IQ3) | 1.6% | 1.7% |
| Interquartile Range (IQR) | 1.1% | 0.84% |
| Standard Deviation (Sample) | 1.2% | 0.58% |
| Standard Deviation (Population) | 1.2% | 0.57% |
Similar Demographics by Doctorate Degree
Demographics Similar to Sioux by Doctorate Degree
In terms of doctorate degree, the demographic groups most similar to Sioux are Yaqui (1.5%, a difference of 0.020%), Immigrants from Barbados (1.5%, a difference of 0.11%), Aleut (1.5%, a difference of 0.14%), Paiute (1.5%, a difference of 0.19%), and Immigrants from Trinidad and Tobago (1.5%, a difference of 0.20%).
| Demographics | Rating | Rank | Doctorate Degree |
| Immigrants | Liberia | 0.5 /100 | #266 | Tragic 1.5% |
| Kiowa | 0.5 /100 | #267 | Tragic 1.5% |
| U.S. Virgin Islanders | 0.5 /100 | #268 | Tragic 1.5% |
| Crow | 0.5 /100 | #269 | Tragic 1.5% |
| Salvadorans | 0.5 /100 | #270 | Tragic 1.5% |
| Immigrants | Trinidad and Tobago | 0.5 /100 | #271 | Tragic 1.5% |
| Immigrants | Barbados | 0.4 /100 | #272 | Tragic 1.5% |
| Sioux | 0.4 /100 | #273 | Tragic 1.5% |
| Yaqui | 0.4 /100 | #274 | Tragic 1.5% |
| Aleuts | 0.4 /100 | #275 | Tragic 1.5% |
| Paiute | 0.4 /100 | #276 | Tragic 1.5% |
| Bahamians | 0.4 /100 | #277 | Tragic 1.5% |
| Hawaiians | 0.4 /100 | #278 | Tragic 1.5% |
| Marshallese | 0.4 /100 | #279 | Tragic 1.5% |
| Ecuadorians | 0.4 /100 | #280 | Tragic 1.5% |
Demographics Similar to Uruguayans by Doctorate Degree
In terms of doctorate degree, the demographic groups most similar to Uruguayans are Immigrants from Somalia (1.8%, a difference of 0.15%), German Russian (1.8%, a difference of 0.17%), Subsaharan African (1.8%, a difference of 0.22%), Chinese (1.8%, a difference of 0.23%), and Dutch (1.8%, a difference of 0.24%).
| Demographics | Rating | Rank | Doctorate Degree |
| Czechoslovakians | 33.0 /100 | #187 | Fair 1.8% |
| Germans | 30.5 /100 | #188 | Fair 1.8% |
| French Canadians | 30.2 /100 | #189 | Fair 1.8% |
| Immigrants | Costa Rica | 30.2 /100 | #190 | Fair 1.8% |
| South Americans | 29.5 /100 | #191 | Fair 1.8% |
| Dutch | 27.4 /100 | #192 | Fair 1.8% |
| German Russians | 27.1 /100 | #193 | Fair 1.8% |
| Uruguayans | 26.2 /100 | #194 | Fair 1.8% |
| Immigrants | Somalia | 25.4 /100 | #195 | Fair 1.8% |
| Sub-Saharan Africans | 25.1 /100 | #196 | Fair 1.8% |
| Chinese | 25.1 /100 | #197 | Fair 1.8% |
| Immigrants | Ghana | 24.6 /100 | #198 | Fair 1.8% |
| Immigrants | South America | 23.3 /100 | #199 | Fair 1.8% |
| Whites/Caucasians | 22.8 /100 | #200 | Fair 1.8% |
| Immigrants | Nigeria | 22.4 /100 | #201 | Fair 1.8% |