Sioux vs Thai High School Diploma
COMPARE
Sioux
Thai
High School Diploma
High School Diploma Comparison
Sioux
Thais
87.9%
HIGH SCHOOL DIPLOMA
2.7/ 100
METRIC RATING
238th/ 347
METRIC RANK
91.5%
HIGH SCHOOL DIPLOMA
99.9/ 100
METRIC RATING
25th/ 347
METRIC RANK
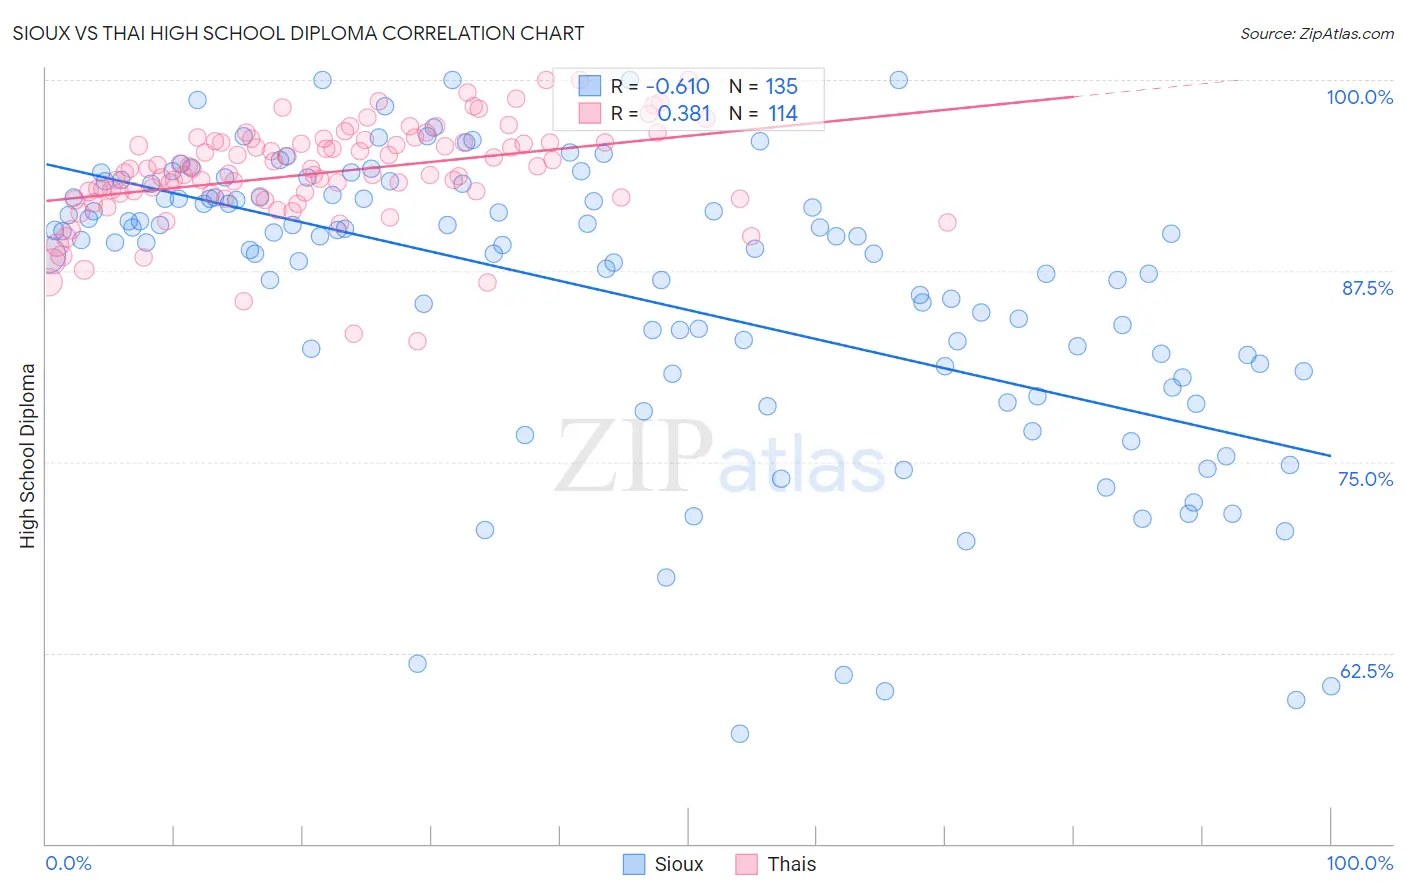
Sioux vs Thai High School Diploma Correlation Chart
The statistical analysis conducted on geographies consisting of 234,200,396 people shows a significant negative correlation between the proportion of Sioux and percentage of population with at least high school diploma education in the United States with a correlation coefficient (R) of -0.610 and weighted average of 87.9%. Similarly, the statistical analysis conducted on geographies consisting of 475,814,962 people shows a mild positive correlation between the proportion of Thais and percentage of population with at least high school diploma education in the United States with a correlation coefficient (R) of 0.381 and weighted average of 91.5%, a difference of 4.1%.
High School Diploma Correlation Summary
| Measurement | Sioux | Thai |
| Minimum | 57.2% | 82.9% |
| Maximum | 100.0% | 100.0% |
| Range | 42.8% | 17.1% |
| Mean | 86.2% | 93.9% |
| Median | 89.4% | 94.2% |
| Interquartile 25% (IQ1) | 81.3% | 92.4% |
| Interquartile 75% (IQ3) | 92.3% | 95.9% |
| Interquartile Range (IQR) | 11.0% | 3.5% |
| Standard Deviation (Sample) | 9.4% | 3.2% |
| Standard Deviation (Population) | 9.4% | 3.2% |
Similar Demographics by High School Diploma
Demographics Similar to Sioux by High School Diploma
In terms of high school diploma, the demographic groups most similar to Sioux are Taiwanese (87.9%, a difference of 0.0%), South American (87.9%, a difference of 0.0%), Subsaharan African (87.9%, a difference of 0.010%), Immigrants from Bahamas (88.0%, a difference of 0.030%), and Immigrants from Panama (88.0%, a difference of 0.050%).
| Demographics | Rating | Rank | High School Diploma |
| Colombians | 3.8 /100 | #231 | Tragic 88.1% |
| Immigrants | Middle Africa | 3.4 /100 | #232 | Tragic 88.0% |
| Immigrants | Panama | 3.1 /100 | #233 | Tragic 88.0% |
| Immigrants | Thailand | 3.1 /100 | #234 | Tragic 88.0% |
| Immigrants | Bahamas | 2.9 /100 | #235 | Tragic 88.0% |
| Sub-Saharan Africans | 2.8 /100 | #236 | Tragic 87.9% |
| Taiwanese | 2.8 /100 | #237 | Tragic 87.9% |
| Sioux | 2.7 /100 | #238 | Tragic 87.9% |
| South Americans | 2.7 /100 | #239 | Tragic 87.9% |
| Comanche | 2.2 /100 | #240 | Tragic 87.9% |
| Immigrants | Uzbekistan | 2.1 /100 | #241 | Tragic 87.8% |
| Cheyenne | 2.1 /100 | #242 | Tragic 87.8% |
| Immigrants | Philippines | 1.9 /100 | #243 | Tragic 87.8% |
| Choctaw | 1.9 /100 | #244 | Tragic 87.8% |
| Peruvians | 1.9 /100 | #245 | Tragic 87.8% |
Demographics Similar to Thais by High School Diploma
In terms of high school diploma, the demographic groups most similar to Thais are Scandinavian (91.5%, a difference of 0.0%), Italian (91.5%, a difference of 0.0%), Estonian (91.6%, a difference of 0.030%), Czech (91.6%, a difference of 0.050%), and Filipino (91.6%, a difference of 0.050%).
| Demographics | Rating | Rank | High School Diploma |
| Germans | 99.9 /100 | #18 | Exceptional 91.7% |
| Maltese | 99.9 /100 | #19 | Exceptional 91.6% |
| Czechs | 99.9 /100 | #20 | Exceptional 91.6% |
| Filipinos | 99.9 /100 | #21 | Exceptional 91.6% |
| Estonians | 99.9 /100 | #22 | Exceptional 91.6% |
| Scandinavians | 99.9 /100 | #23 | Exceptional 91.5% |
| Italians | 99.9 /100 | #24 | Exceptional 91.5% |
| Thais | 99.9 /100 | #25 | Exceptional 91.5% |
| Russians | 99.9 /100 | #26 | Exceptional 91.5% |
| Cypriots | 99.9 /100 | #27 | Exceptional 91.5% |
| Tlingit-Haida | 99.9 /100 | #28 | Exceptional 91.4% |
| Europeans | 99.9 /100 | #29 | Exceptional 91.4% |
| Iranians | 99.9 /100 | #30 | Exceptional 91.4% |
| Immigrants | Northern Europe | 99.9 /100 | #31 | Exceptional 91.4% |
| English | 99.9 /100 | #32 | Exceptional 91.4% |