Sioux vs Immigrants from Pakistan College, 1 year or more
COMPARE
Sioux
Immigrants from Pakistan
College, 1 year or more
College, 1 year or more Comparison
Sioux
Immigrants from Pakistan
53.0%
COLLEGE, 1 YEAR OR MORE
0.0/ 100
METRIC RATING
296th/ 347
METRIC RANK
62.8%
COLLEGE, 1 YEAR OR MORE
98.6/ 100
METRIC RATING
85th/ 347
METRIC RANK
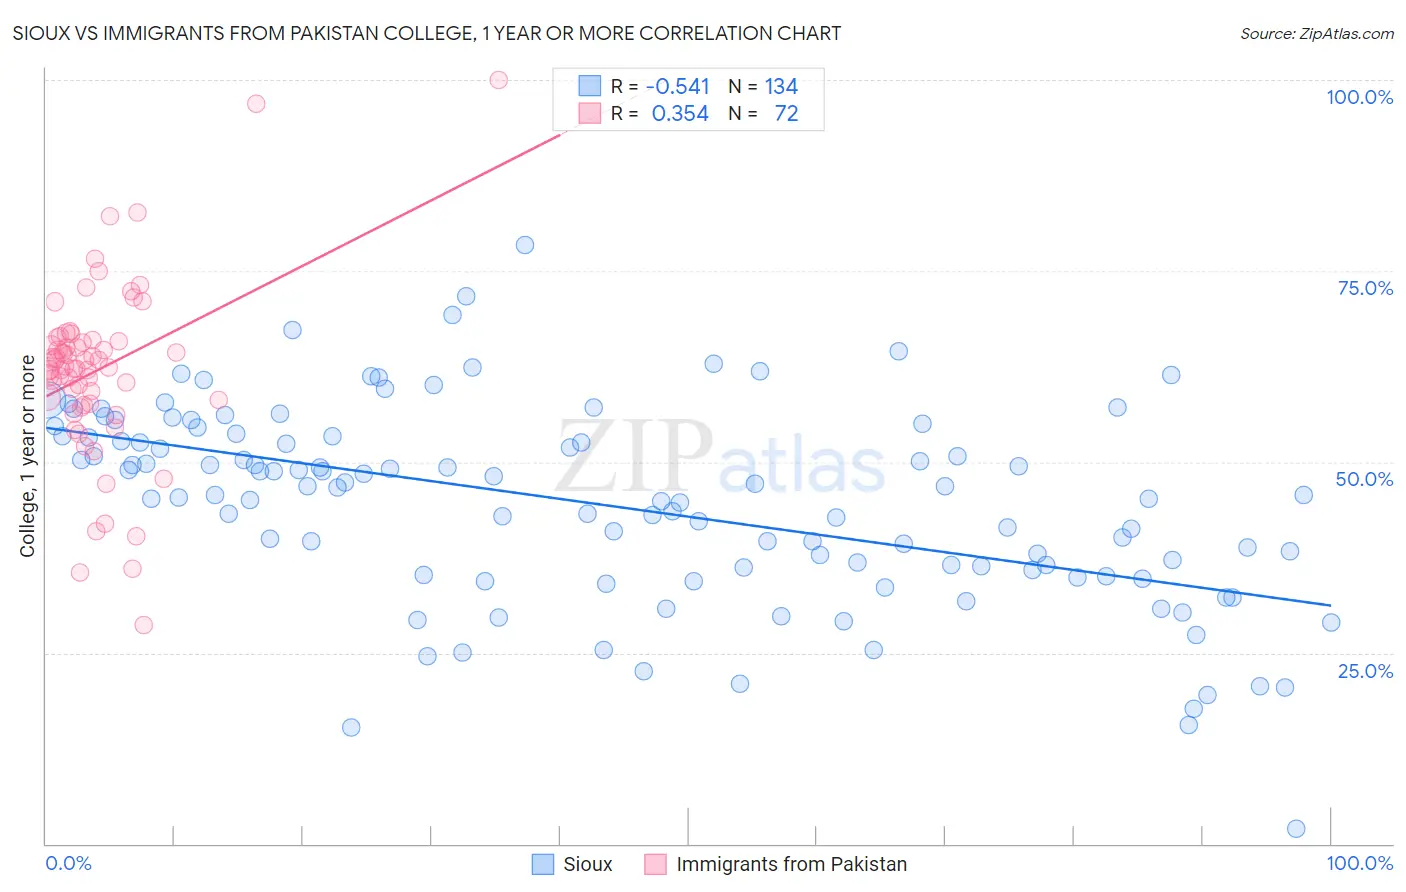
Sioux vs Immigrants from Pakistan College, 1 year or more Correlation Chart
The statistical analysis conducted on geographies consisting of 234,199,467 people shows a substantial negative correlation between the proportion of Sioux and percentage of population with at least college, 1 year or more education in the United States with a correlation coefficient (R) of -0.541 and weighted average of 53.0%. Similarly, the statistical analysis conducted on geographies consisting of 283,910,237 people shows a mild positive correlation between the proportion of Immigrants from Pakistan and percentage of population with at least college, 1 year or more education in the United States with a correlation coefficient (R) of 0.354 and weighted average of 62.8%, a difference of 18.4%.
College, 1 year or more Correlation Summary
| Measurement | Sioux | Immigrants from Pakistan |
| Minimum | 2.0% | 28.6% |
| Maximum | 78.4% | 100.0% |
| Range | 76.4% | 71.4% |
| Mean | 44.3% | 62.0% |
| Median | 45.6% | 62.5% |
| Interquartile 25% (IQ1) | 35.8% | 57.9% |
| Interquartile 75% (IQ3) | 53.3% | 65.9% |
| Interquartile Range (IQR) | 17.5% | 8.1% |
| Standard Deviation (Sample) | 13.0% | 11.6% |
| Standard Deviation (Population) | 12.9% | 11.5% |
Similar Demographics by College, 1 year or more
Demographics Similar to Sioux by College, 1 year or more
In terms of college, 1 year or more, the demographic groups most similar to Sioux are Paiute (52.9%, a difference of 0.28%), Yaqui (53.2%, a difference of 0.34%), Cherokee (53.2%, a difference of 0.35%), Black/African American (53.3%, a difference of 0.56%), and Chickasaw (53.3%, a difference of 0.58%).
| Demographics | Rating | Rank | College, 1 year or more |
| Immigrants | Ecuador | 0.0 /100 | #289 | Tragic 53.4% |
| Alaskan Athabascans | 0.0 /100 | #290 | Tragic 53.4% |
| Cubans | 0.0 /100 | #291 | Tragic 53.4% |
| Chickasaw | 0.0 /100 | #292 | Tragic 53.3% |
| Blacks/African Americans | 0.0 /100 | #293 | Tragic 53.3% |
| Cherokee | 0.0 /100 | #294 | Tragic 53.2% |
| Yaqui | 0.0 /100 | #295 | Tragic 53.2% |
| Sioux | 0.0 /100 | #296 | Tragic 53.0% |
| Paiute | 0.0 /100 | #297 | Tragic 52.9% |
| Immigrants | Dominica | 0.0 /100 | #298 | Tragic 52.5% |
| Immigrants | Nicaragua | 0.0 /100 | #299 | Tragic 52.4% |
| Choctaw | 0.0 /100 | #300 | Tragic 52.3% |
| Haitians | 0.0 /100 | #301 | Tragic 52.3% |
| Puerto Ricans | 0.0 /100 | #302 | Tragic 52.2% |
| Creek | 0.0 /100 | #303 | Tragic 52.2% |
Demographics Similar to Immigrants from Pakistan by College, 1 year or more
In terms of college, 1 year or more, the demographic groups most similar to Immigrants from Pakistan are Immigrants from England (62.8%, a difference of 0.010%), Immigrants from Western Europe (62.7%, a difference of 0.020%), Immigrants from Argentina (62.8%, a difference of 0.040%), Immigrants from Hungary (62.7%, a difference of 0.040%), and Immigrants from Bolivia (62.8%, a difference of 0.080%).
| Demographics | Rating | Rank | College, 1 year or more |
| Immigrants | Lebanon | 98.8 /100 | #78 | Exceptional 62.9% |
| Northern Europeans | 98.8 /100 | #79 | Exceptional 62.9% |
| Lithuanians | 98.8 /100 | #80 | Exceptional 62.9% |
| Laotians | 98.7 /100 | #81 | Exceptional 62.8% |
| Immigrants | Bolivia | 98.7 /100 | #82 | Exceptional 62.8% |
| Immigrants | Argentina | 98.6 /100 | #83 | Exceptional 62.8% |
| Immigrants | England | 98.6 /100 | #84 | Exceptional 62.8% |
| Immigrants | Pakistan | 98.6 /100 | #85 | Exceptional 62.8% |
| Immigrants | Western Europe | 98.6 /100 | #86 | Exceptional 62.7% |
| Immigrants | Hungary | 98.6 /100 | #87 | Exceptional 62.7% |
| Greeks | 98.3 /100 | #88 | Exceptional 62.6% |
| Immigrants | Ethiopia | 98.2 /100 | #89 | Exceptional 62.6% |
| Immigrants | Western Asia | 97.9 /100 | #90 | Exceptional 62.5% |
| Immigrants | Eastern Europe | 97.8 /100 | #91 | Exceptional 62.4% |
| Immigrants | Egypt | 97.8 /100 | #92 | Exceptional 62.4% |