Shoshone vs Immigrants from Russia Professional Degree
COMPARE
Shoshone
Immigrants from Russia
Professional Degree
Professional Degree Comparison
Shoshone
Immigrants from Russia
3.3%
PROFESSIONAL DEGREE
0.1/ 100
METRIC RATING
308th/ 347
METRIC RANK
6.0%
PROFESSIONAL DEGREE
100.0/ 100
METRIC RATING
36th/ 347
METRIC RANK
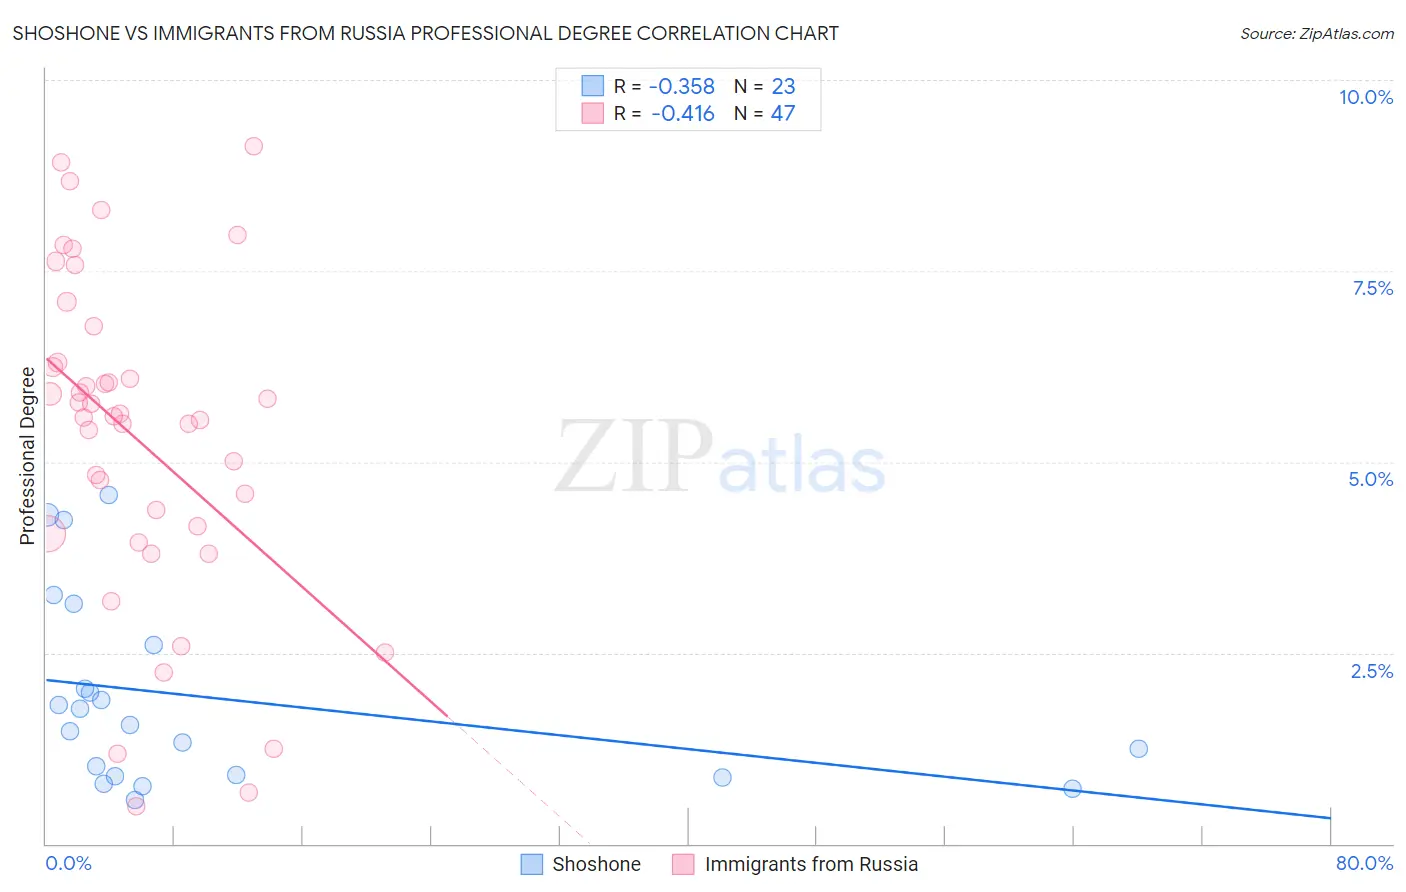
Shoshone vs Immigrants from Russia Professional Degree Correlation Chart
The statistical analysis conducted on geographies consisting of 66,513,785 people shows a mild negative correlation between the proportion of Shoshone and percentage of population with at least professional degree education in the United States with a correlation coefficient (R) of -0.358 and weighted average of 3.3%. Similarly, the statistical analysis conducted on geographies consisting of 347,458,890 people shows a moderate negative correlation between the proportion of Immigrants from Russia and percentage of population with at least professional degree education in the United States with a correlation coefficient (R) of -0.416 and weighted average of 6.0%, a difference of 82.5%.
Professional Degree Correlation Summary
| Measurement | Shoshone | Immigrants from Russia |
| Minimum | 0.57% | 0.49% |
| Maximum | 4.6% | 9.1% |
| Range | 4.0% | 8.6% |
| Mean | 1.9% | 5.3% |
| Median | 1.6% | 5.6% |
| Interquartile 25% (IQ1) | 0.89% | 4.1% |
| Interquartile 75% (IQ3) | 2.6% | 6.3% |
| Interquartile Range (IQR) | 1.7% | 2.2% |
| Standard Deviation (Sample) | 1.2% | 2.1% |
| Standard Deviation (Population) | 1.2% | 2.1% |
Similar Demographics by Professional Degree
Demographics Similar to Shoshone by Professional Degree
In terms of professional degree, the demographic groups most similar to Shoshone are Pima (3.3%, a difference of 0.010%), Immigrants from Latin America (3.3%, a difference of 0.33%), Cherokee (3.3%, a difference of 0.48%), Samoan (3.3%, a difference of 0.50%), and Sioux (3.3%, a difference of 1.1%).
| Demographics | Rating | Rank | Professional Degree |
| Immigrants | Dominican Republic | 0.2 /100 | #301 | Tragic 3.4% |
| Malaysians | 0.2 /100 | #302 | Tragic 3.4% |
| Immigrants | Haiti | 0.2 /100 | #303 | Tragic 3.4% |
| Cajuns | 0.2 /100 | #304 | Tragic 3.4% |
| Chickasaw | 0.1 /100 | #305 | Tragic 3.4% |
| Cape Verdeans | 0.1 /100 | #306 | Tragic 3.4% |
| Samoans | 0.1 /100 | #307 | Tragic 3.3% |
| Shoshone | 0.1 /100 | #308 | Tragic 3.3% |
| Pima | 0.1 /100 | #309 | Tragic 3.3% |
| Immigrants | Latin America | 0.1 /100 | #310 | Tragic 3.3% |
| Cherokee | 0.1 /100 | #311 | Tragic 3.3% |
| Sioux | 0.1 /100 | #312 | Tragic 3.3% |
| Yuman | 0.1 /100 | #313 | Tragic 3.3% |
| Mexican American Indians | 0.1 /100 | #314 | Tragic 3.3% |
| Immigrants | Laos | 0.1 /100 | #315 | Tragic 3.2% |
Demographics Similar to Immigrants from Russia by Professional Degree
In terms of professional degree, the demographic groups most similar to Immigrants from Russia are Immigrants from Austria (6.0%, a difference of 0.32%), Immigrants from Norway (6.0%, a difference of 0.51%), Immigrants from South Africa (6.0%, a difference of 0.77%), Immigrants from Korea (6.1%, a difference of 0.90%), and Cambodian (6.0%, a difference of 1.2%).
| Demographics | Rating | Rank | Professional Degree |
| Immigrants | Sri Lanka | 100.0 /100 | #29 | Exceptional 6.2% |
| Immigrants | Turkey | 100.0 /100 | #30 | Exceptional 6.2% |
| Immigrants | India | 100.0 /100 | #31 | Exceptional 6.2% |
| Thais | 100.0 /100 | #32 | Exceptional 6.1% |
| Burmese | 100.0 /100 | #33 | Exceptional 6.1% |
| Mongolians | 100.0 /100 | #34 | Exceptional 6.1% |
| Immigrants | Korea | 100.0 /100 | #35 | Exceptional 6.1% |
| Immigrants | Russia | 100.0 /100 | #36 | Exceptional 6.0% |
| Immigrants | Austria | 100.0 /100 | #37 | Exceptional 6.0% |
| Immigrants | Norway | 100.0 /100 | #38 | Exceptional 6.0% |
| Immigrants | South Africa | 100.0 /100 | #39 | Exceptional 6.0% |
| Cambodians | 100.0 /100 | #40 | Exceptional 6.0% |
| New Zealanders | 100.0 /100 | #41 | Exceptional 6.0% |
| Estonians | 100.0 /100 | #42 | Exceptional 6.0% |
| Immigrants | Saudi Arabia | 100.0 /100 | #43 | Exceptional 5.9% |