Serbian vs Immigrants from Oceania High School Diploma
COMPARE
Serbian
Immigrants from Oceania
High School Diploma
High School Diploma Comparison
Serbians
Immigrants from Oceania
91.1%
HIGH SCHOOL DIPLOMA
99.7/ 100
METRIC RATING
55th/ 347
METRIC RANK
88.8%
HIGH SCHOOL DIPLOMA
26.9/ 100
METRIC RATING
193rd/ 347
METRIC RANK
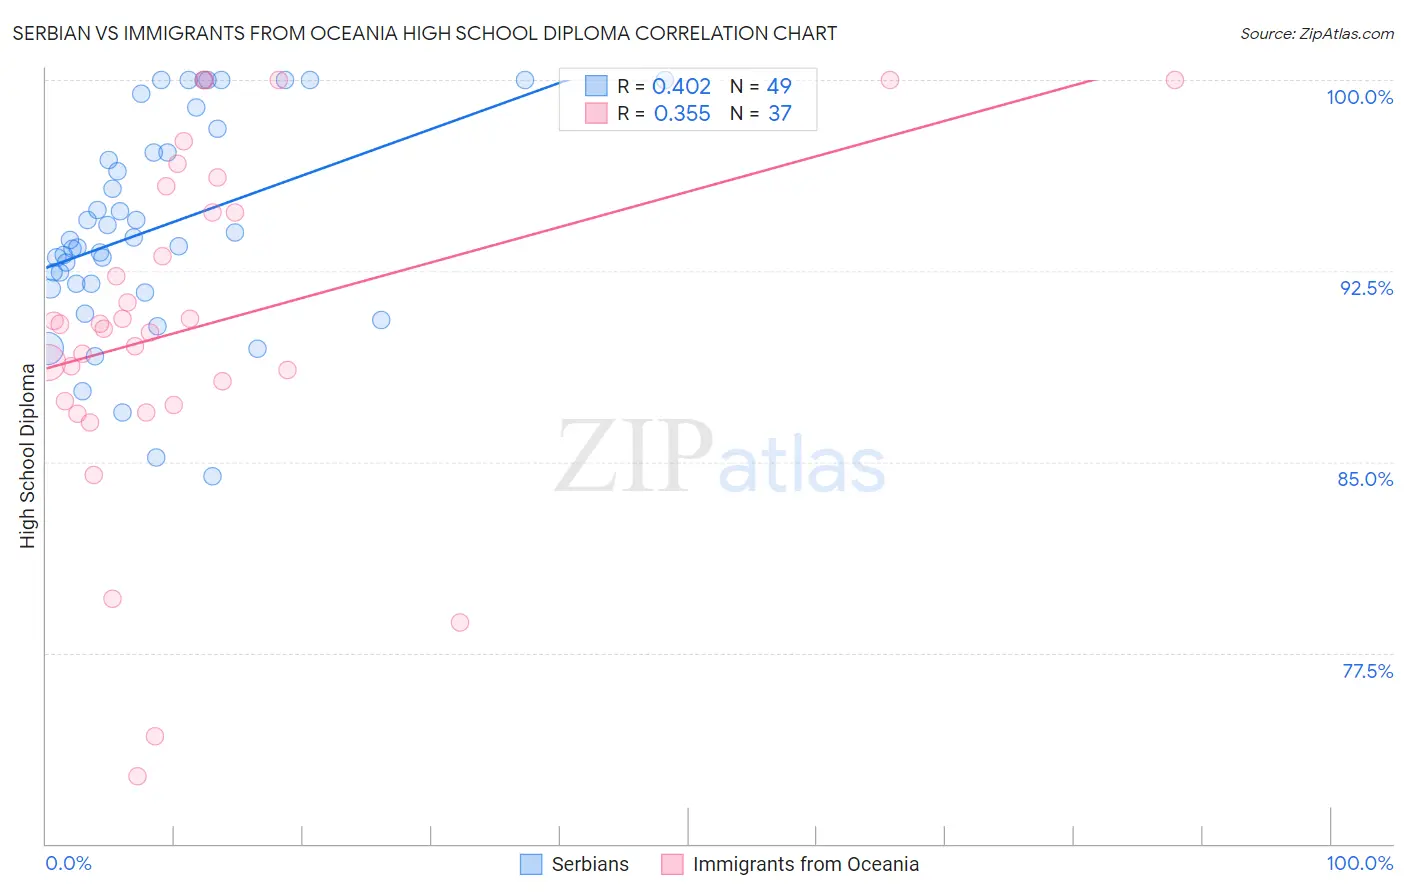
Serbian vs Immigrants from Oceania High School Diploma Correlation Chart
The statistical analysis conducted on geographies consisting of 267,640,774 people shows a moderate positive correlation between the proportion of Serbians and percentage of population with at least high school diploma education in the United States with a correlation coefficient (R) of 0.402 and weighted average of 91.1%. Similarly, the statistical analysis conducted on geographies consisting of 305,521,521 people shows a mild positive correlation between the proportion of Immigrants from Oceania and percentage of population with at least high school diploma education in the United States with a correlation coefficient (R) of 0.355 and weighted average of 88.8%, a difference of 2.6%.
High School Diploma Correlation Summary
| Measurement | Serbian | Immigrants from Oceania |
| Minimum | 84.5% | 72.6% |
| Maximum | 100.0% | 100.0% |
| Range | 15.5% | 27.4% |
| Mean | 94.2% | 90.4% |
| Median | 93.7% | 90.4% |
| Interquartile 25% (IQ1) | 91.9% | 87.3% |
| Interquartile 75% (IQ3) | 97.6% | 95.3% |
| Interquartile Range (IQR) | 5.7% | 8.0% |
| Standard Deviation (Sample) | 4.1% | 6.7% |
| Standard Deviation (Population) | 4.1% | 6.6% |
Similar Demographics by High School Diploma
Demographics Similar to Serbians by High School Diploma
In terms of high school diploma, the demographic groups most similar to Serbians are Macedonian (91.1%, a difference of 0.010%), Immigrants from Sweden (91.1%, a difference of 0.030%), Immigrants from Belgium (91.1%, a difference of 0.030%), Immigrants from Canada (91.1%, a difference of 0.030%), and New Zealander (91.1%, a difference of 0.040%).
| Demographics | Rating | Rank | High School Diploma |
| Belgians | 99.8 /100 | #48 | Exceptional 91.2% |
| Bhutanese | 99.8 /100 | #49 | Exceptional 91.2% |
| Welsh | 99.8 /100 | #50 | Exceptional 91.2% |
| New Zealanders | 99.7 /100 | #51 | Exceptional 91.1% |
| Immigrants | Sweden | 99.7 /100 | #52 | Exceptional 91.1% |
| Immigrants | Belgium | 99.7 /100 | #53 | Exceptional 91.1% |
| Macedonians | 99.7 /100 | #54 | Exceptional 91.1% |
| Serbians | 99.7 /100 | #55 | Exceptional 91.1% |
| Immigrants | Canada | 99.7 /100 | #56 | Exceptional 91.1% |
| Zimbabweans | 99.7 /100 | #57 | Exceptional 91.1% |
| Slavs | 99.7 /100 | #58 | Exceptional 91.0% |
| Immigrants | North America | 99.7 /100 | #59 | Exceptional 91.0% |
| Immigrants | Japan | 99.6 /100 | #60 | Exceptional 91.0% |
| Immigrants | Taiwan | 99.6 /100 | #61 | Exceptional 91.0% |
| Austrians | 99.6 /100 | #62 | Exceptional 91.0% |
Demographics Similar to Immigrants from Oceania by High School Diploma
In terms of high school diploma, the demographic groups most similar to Immigrants from Oceania are Immigrants from Venezuela (88.8%, a difference of 0.020%), Moroccan (88.8%, a difference of 0.050%), Afghan (88.8%, a difference of 0.060%), Immigrants from Ethiopia (88.9%, a difference of 0.070%), and Immigrants from Southern Europe (88.7%, a difference of 0.070%).
| Demographics | Rating | Rank | High School Diploma |
| Immigrants | Eastern Africa | 35.8 /100 | #186 | Fair 88.9% |
| Guamanians/Chamorros | 35.5 /100 | #187 | Fair 88.9% |
| Immigrants | Sudan | 33.4 /100 | #188 | Fair 88.9% |
| Immigrants | Uganda | 32.6 /100 | #189 | Fair 88.9% |
| Immigrants | Chile | 31.9 /100 | #190 | Fair 88.9% |
| Immigrants | Ethiopia | 30.9 /100 | #191 | Fair 88.9% |
| Moroccans | 29.5 /100 | #192 | Fair 88.8% |
| Immigrants | Oceania | 26.9 /100 | #193 | Fair 88.8% |
| Immigrants | Venezuela | 25.8 /100 | #194 | Fair 88.8% |
| Afghans | 23.9 /100 | #195 | Fair 88.8% |
| Immigrants | Southern Europe | 23.4 /100 | #196 | Fair 88.7% |
| French American Indians | 21.5 /100 | #197 | Fair 88.7% |
| Liberians | 18.8 /100 | #198 | Poor 88.7% |
| Marshallese | 18.7 /100 | #199 | Poor 88.6% |
| Hawaiians | 18.3 /100 | #200 | Poor 88.6% |