Serbian vs Immigrants from Eastern Europe Kindergarten
COMPARE
Serbian
Immigrants from Eastern Europe
Kindergarten
Kindergarten Comparison
Serbians
Immigrants from Eastern Europe
98.4%
KINDERGARTEN
99.6/ 100
METRIC RATING
72nd/ 347
METRIC RANK
98.0%
KINDERGARTEN
59.0/ 100
METRIC RATING
161st/ 347
METRIC RANK
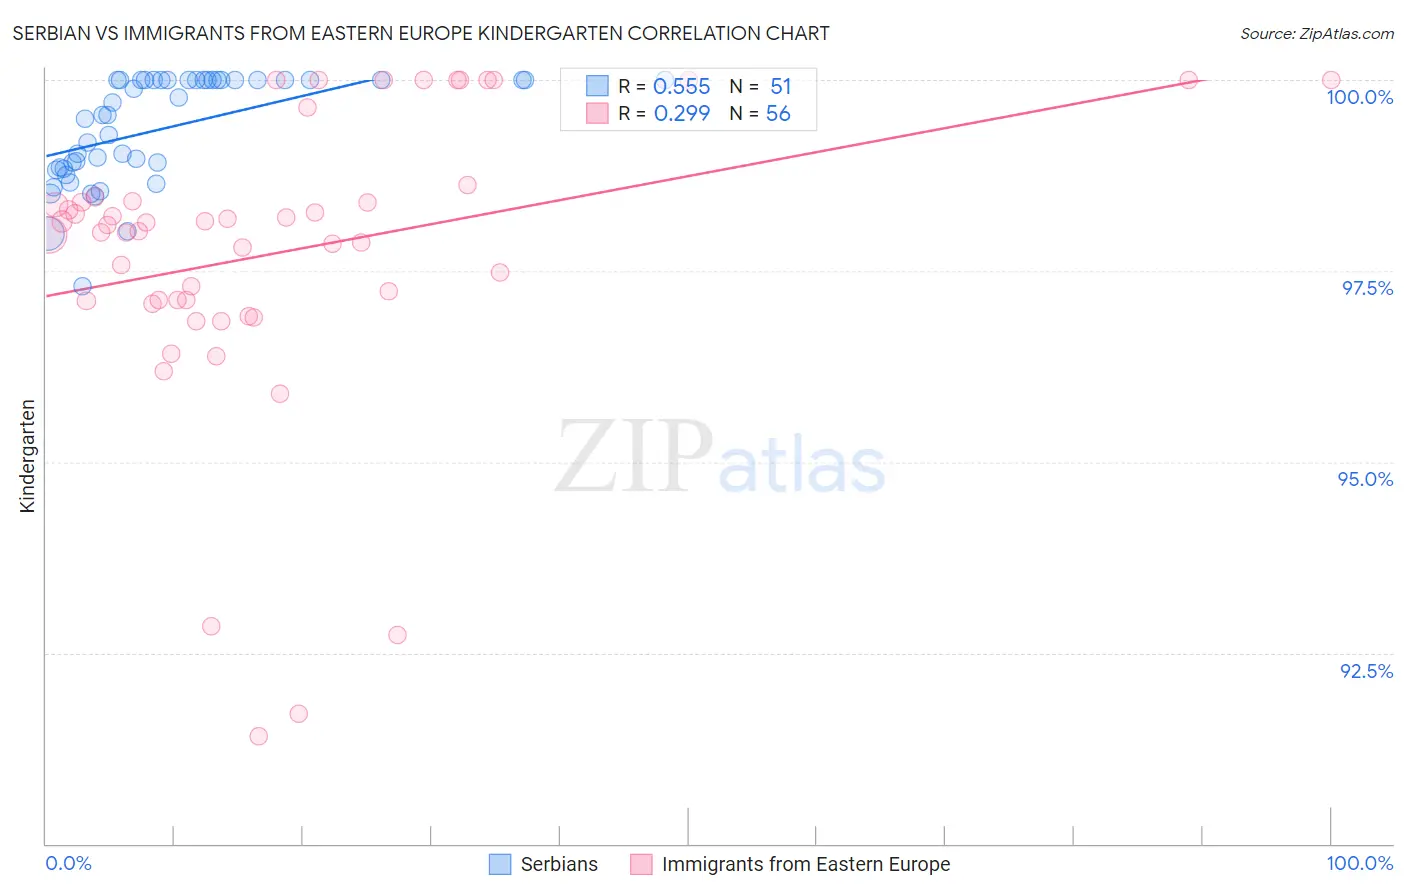
Serbian vs Immigrants from Eastern Europe Kindergarten Correlation Chart
The statistical analysis conducted on geographies consisting of 267,642,942 people shows a substantial positive correlation between the proportion of Serbians and percentage of population with at least kindergarten education in the United States with a correlation coefficient (R) of 0.555 and weighted average of 98.4%. Similarly, the statistical analysis conducted on geographies consisting of 475,879,420 people shows a weak positive correlation between the proportion of Immigrants from Eastern Europe and percentage of population with at least kindergarten education in the United States with a correlation coefficient (R) of 0.299 and weighted average of 98.0%, a difference of 0.40%.
Kindergarten Correlation Summary
| Measurement | Serbian | Immigrants from Eastern Europe |
| Minimum | 97.3% | 91.4% |
| Maximum | 100.0% | 100.0% |
| Range | 2.7% | 8.6% |
| Mean | 99.4% | 97.7% |
| Median | 99.5% | 98.1% |
| Interquartile 25% (IQ1) | 98.8% | 97.1% |
| Interquartile 75% (IQ3) | 100.0% | 98.4% |
| Interquartile Range (IQR) | 1.2% | 1.3% |
| Standard Deviation (Sample) | 0.70% | 1.9% |
| Standard Deviation (Population) | 0.69% | 1.9% |
Similar Demographics by Kindergarten
Demographics Similar to Serbians by Kindergarten
In terms of kindergarten, the demographic groups most similar to Serbians are Immigrants from Northern Europe (98.4%, a difference of 0.0%), Immigrants from Austria (98.4%, a difference of 0.0%), Russian (98.4%, a difference of 0.0%), Chickasaw (98.4%, a difference of 0.0%), and Cheyenne (98.4%, a difference of 0.010%).
| Demographics | Rating | Rank | Kindergarten |
| Maltese | 99.7 /100 | #65 | Exceptional 98.4% |
| Cheyenne | 99.6 /100 | #66 | Exceptional 98.4% |
| Canadians | 99.6 /100 | #67 | Exceptional 98.4% |
| Immigrants | Northern Europe | 99.6 /100 | #68 | Exceptional 98.4% |
| Immigrants | Austria | 99.6 /100 | #69 | Exceptional 98.4% |
| Russians | 99.6 /100 | #70 | Exceptional 98.4% |
| Chickasaw | 99.6 /100 | #71 | Exceptional 98.4% |
| Serbians | 99.6 /100 | #72 | Exceptional 98.4% |
| Cajuns | 99.4 /100 | #73 | Exceptional 98.3% |
| Immigrants | Netherlands | 99.3 /100 | #74 | Exceptional 98.3% |
| Cherokee | 99.3 /100 | #75 | Exceptional 98.3% |
| Immigrants | England | 99.3 /100 | #76 | Exceptional 98.3% |
| Delaware | 99.3 /100 | #77 | Exceptional 98.3% |
| Shoshone | 99.2 /100 | #78 | Exceptional 98.3% |
| Immigrants | Belgium | 99.2 /100 | #79 | Exceptional 98.3% |
Demographics Similar to Immigrants from Eastern Europe by Kindergarten
In terms of kindergarten, the demographic groups most similar to Immigrants from Eastern Europe are Immigrants from Russia (98.0%, a difference of 0.0%), Immigrants from Italy (98.0%, a difference of 0.0%), Spanish American (98.0%, a difference of 0.0%), Immigrants from Micronesia (98.0%, a difference of 0.0%), and Ugandan (98.0%, a difference of 0.010%).
| Demographics | Rating | Rank | Kindergarten |
| Immigrants | Iran | 68.8 /100 | #154 | Good 98.0% |
| Comanche | 68.3 /100 | #155 | Good 98.0% |
| Immigrants | South Central Asia | 66.6 /100 | #156 | Good 98.0% |
| Immigrants | North Macedonia | 66.4 /100 | #157 | Good 98.0% |
| Venezuelans | 64.7 /100 | #158 | Good 98.0% |
| French American Indians | 63.7 /100 | #159 | Good 98.0% |
| Immigrants | Russia | 59.0 /100 | #160 | Average 98.0% |
| Immigrants | Eastern Europe | 59.0 /100 | #161 | Average 98.0% |
| Immigrants | Italy | 58.9 /100 | #162 | Average 98.0% |
| Spanish Americans | 57.8 /100 | #163 | Average 98.0% |
| Immigrants | Micronesia | 57.7 /100 | #164 | Average 98.0% |
| Ugandans | 56.9 /100 | #165 | Average 98.0% |
| Chileans | 56.3 /100 | #166 | Average 98.0% |
| Immigrants | Spain | 54.6 /100 | #167 | Average 98.0% |
| Navajo | 54.4 /100 | #168 | Average 98.0% |