Senegalese vs Scottish 11th Grade
COMPARE
Senegalese
Scottish
11th Grade
11th Grade Comparison
Senegalese
Scottish
91.6%
11TH GRADE
1.4/ 100
METRIC RATING
244th/ 347
METRIC RANK
94.4%
11TH GRADE
100.0/ 100
METRIC RATING
26th/ 347
METRIC RANK
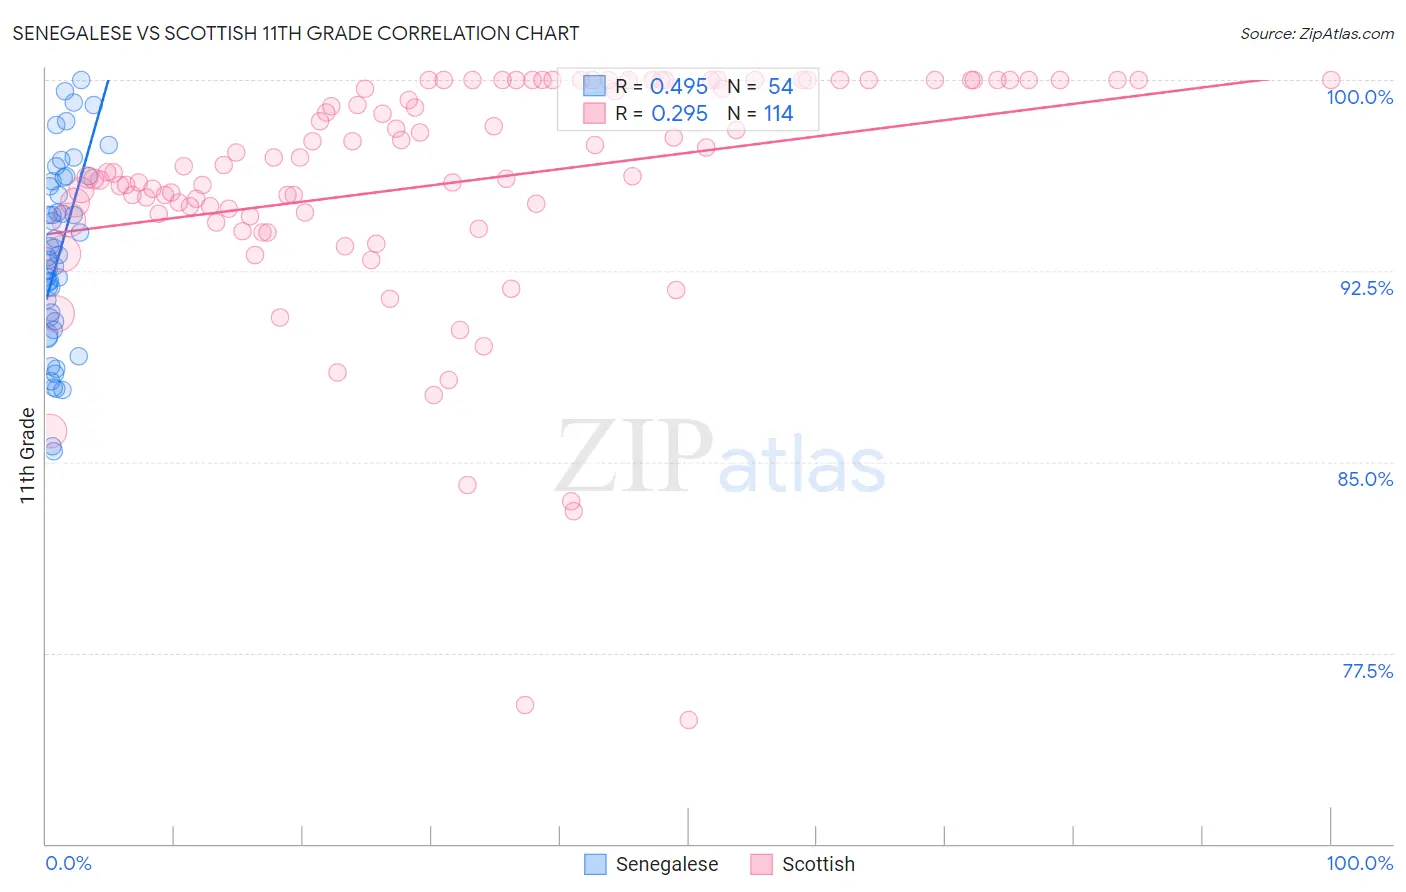
Senegalese vs Scottish 11th Grade Correlation Chart
The statistical analysis conducted on geographies consisting of 78,142,569 people shows a moderate positive correlation between the proportion of Senegalese and percentage of population with at least 11th grade education in the United States with a correlation coefficient (R) of 0.495 and weighted average of 91.6%. Similarly, the statistical analysis conducted on geographies consisting of 567,140,505 people shows a weak positive correlation between the proportion of Scottish and percentage of population with at least 11th grade education in the United States with a correlation coefficient (R) of 0.295 and weighted average of 94.4%, a difference of 3.1%.
11th Grade Correlation Summary
| Measurement | Senegalese | Scottish |
| Minimum | 85.4% | 74.9% |
| Maximum | 100.0% | 100.0% |
| Range | 14.6% | 25.1% |
| Mean | 93.1% | 96.0% |
| Median | 93.1% | 96.5% |
| Interquartile 25% (IQ1) | 90.5% | 94.7% |
| Interquartile 75% (IQ3) | 96.0% | 100.0% |
| Interquartile Range (IQR) | 5.5% | 5.3% |
| Standard Deviation (Sample) | 3.6% | 4.7% |
| Standard Deviation (Population) | 3.6% | 4.7% |
Similar Demographics by 11th Grade
Demographics Similar to Senegalese by 11th Grade
In terms of 11th grade, the demographic groups most similar to Senegalese are Immigrants from Thailand (91.6%, a difference of 0.010%), African (91.5%, a difference of 0.010%), Immigrants from Middle Africa (91.6%, a difference of 0.030%), Seminole (91.5%, a difference of 0.050%), and Bahamian (91.6%, a difference of 0.070%).
| Demographics | Rating | Rank | 11th Grade |
| Immigrants | Bolivia | 2.8 /100 | #237 | Tragic 91.7% |
| Comanche | 2.6 /100 | #238 | Tragic 91.7% |
| Hopi | 2.5 /100 | #239 | Tragic 91.7% |
| South Americans | 2.0 /100 | #240 | Tragic 91.6% |
| Bahamians | 1.8 /100 | #241 | Tragic 91.6% |
| Immigrants | Middle Africa | 1.6 /100 | #242 | Tragic 91.6% |
| Immigrants | Thailand | 1.4 /100 | #243 | Tragic 91.6% |
| Senegalese | 1.4 /100 | #244 | Tragic 91.6% |
| Africans | 1.3 /100 | #245 | Tragic 91.5% |
| Seminole | 1.2 /100 | #246 | Tragic 91.5% |
| Immigrants | Philippines | 1.0 /100 | #247 | Tragic 91.5% |
| Immigrants | Uzbekistan | 1.0 /100 | #248 | Tragic 91.5% |
| Peruvians | 1.0 /100 | #249 | Tragic 91.5% |
| Ghanaians | 0.9 /100 | #250 | Tragic 91.5% |
| Immigrants | Costa Rica | 0.9 /100 | #251 | Tragic 91.4% |
Demographics Similar to Scottish by 11th Grade
In terms of 11th grade, the demographic groups most similar to Scottish are Irish (94.4%, a difference of 0.0%), English (94.4%, a difference of 0.020%), European (94.4%, a difference of 0.020%), Estonian (94.4%, a difference of 0.030%), and Tsimshian (94.4%, a difference of 0.050%).
| Demographics | Rating | Rank | 11th Grade |
| Scandinavians | 100.0 /100 | #19 | Exceptional 94.5% |
| Italians | 100.0 /100 | #20 | Exceptional 94.5% |
| Tlingit-Haida | 100.0 /100 | #21 | Exceptional 94.4% |
| Tsimshian | 100.0 /100 | #22 | Exceptional 94.4% |
| Czechs | 100.0 /100 | #23 | Exceptional 94.4% |
| English | 100.0 /100 | #24 | Exceptional 94.4% |
| Irish | 100.0 /100 | #25 | Exceptional 94.4% |
| Scottish | 100.0 /100 | #26 | Exceptional 94.4% |
| Europeans | 100.0 /100 | #27 | Exceptional 94.4% |
| Estonians | 100.0 /100 | #28 | Exceptional 94.4% |
| Dutch | 100.0 /100 | #29 | Exceptional 94.3% |
| Russians | 100.0 /100 | #30 | Exceptional 94.3% |
| Welsh | 99.9 /100 | #31 | Exceptional 94.2% |
| Belgians | 99.9 /100 | #32 | Exceptional 94.2% |
| British | 99.9 /100 | #33 | Exceptional 94.2% |