Senegalese vs Immigrants from Panama High School Diploma
COMPARE
Senegalese
Immigrants from Panama
High School Diploma
High School Diploma Comparison
Senegalese
Immigrants from Panama
87.7%
HIGH SCHOOL DIPLOMA
1.5/ 100
METRIC RATING
249th/ 347
METRIC RANK
88.0%
HIGH SCHOOL DIPLOMA
3.1/ 100
METRIC RATING
233rd/ 347
METRIC RANK
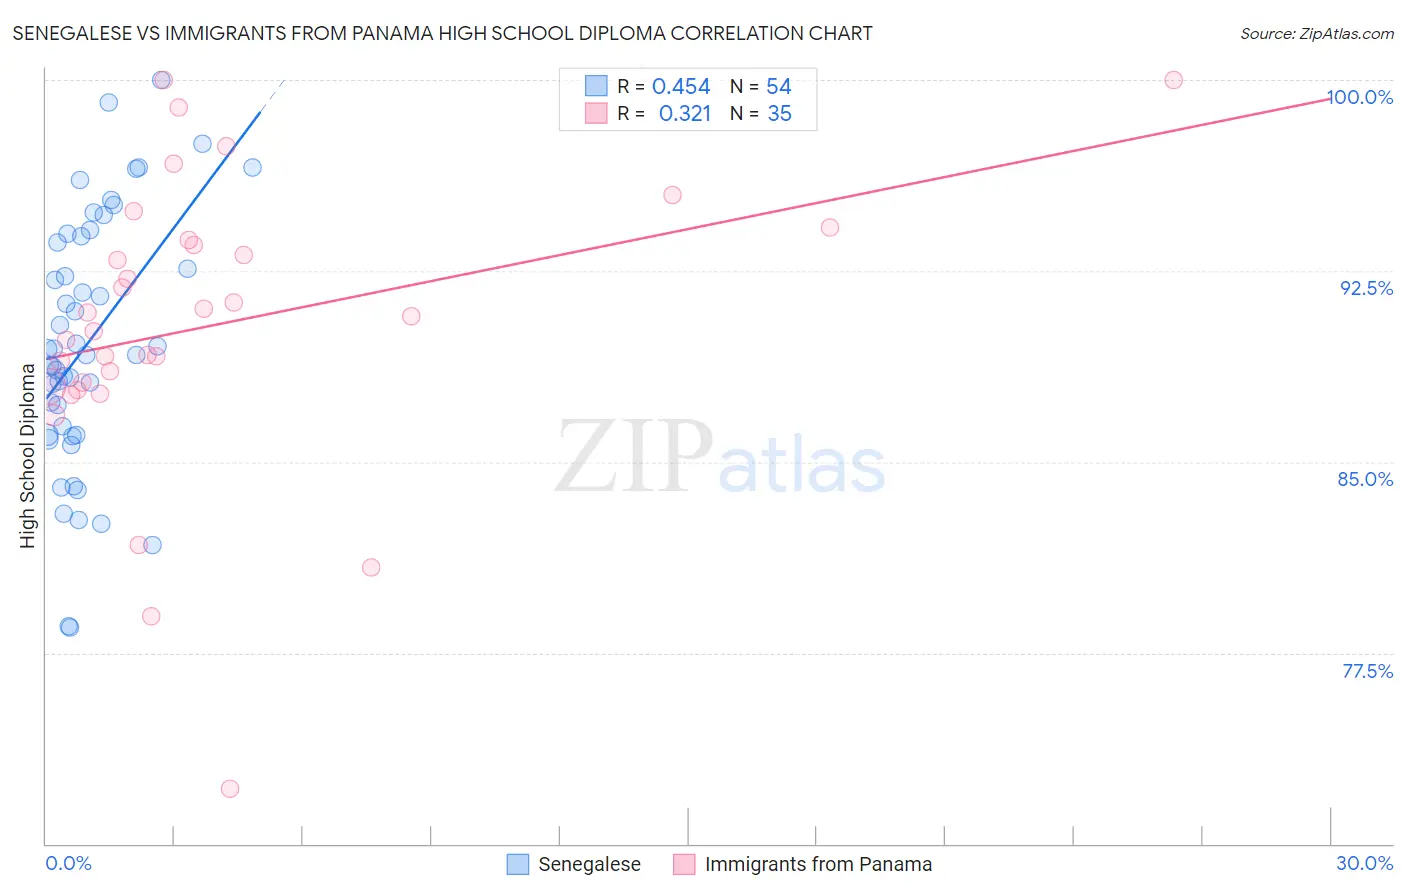
Senegalese vs Immigrants from Panama High School Diploma Correlation Chart
The statistical analysis conducted on geographies consisting of 78,142,569 people shows a moderate positive correlation between the proportion of Senegalese and percentage of population with at least high school diploma education in the United States with a correlation coefficient (R) of 0.454 and weighted average of 87.7%. Similarly, the statistical analysis conducted on geographies consisting of 221,182,871 people shows a mild positive correlation between the proportion of Immigrants from Panama and percentage of population with at least high school diploma education in the United States with a correlation coefficient (R) of 0.321 and weighted average of 88.0%, a difference of 0.28%.
High School Diploma Correlation Summary
| Measurement | Senegalese | Immigrants from Panama |
| Minimum | 78.5% | 72.1% |
| Maximum | 100.0% | 100.0% |
| Range | 21.5% | 27.9% |
| Mean | 89.7% | 90.4% |
| Median | 89.3% | 90.7% |
| Interquartile 25% (IQ1) | 86.1% | 88.0% |
| Interquartile 75% (IQ3) | 93.8% | 93.7% |
| Interquartile Range (IQR) | 7.8% | 5.7% |
| Standard Deviation (Sample) | 5.0% | 5.8% |
| Standard Deviation (Population) | 4.9% | 5.7% |
Demographics Similar to Senegalese and Immigrants from Panama by High School Diploma
In terms of high school diploma, the demographic groups most similar to Senegalese are Immigrants from Nigeria (87.7%, a difference of 0.0%), Spanish American (87.7%, a difference of 0.010%), Ghanaian (87.7%, a difference of 0.040%), Immigrants from Eritrea (87.8%, a difference of 0.050%), and Immigrants from Costa Rica (87.8%, a difference of 0.050%). Similarly, the demographic groups most similar to Immigrants from Panama are Immigrants from Thailand (88.0%, a difference of 0.010%), Immigrants from Bahamas (88.0%, a difference of 0.020%), Immigrants from Middle Africa (88.0%, a difference of 0.040%), Subsaharan African (87.9%, a difference of 0.040%), and Taiwanese (87.9%, a difference of 0.050%).
| Demographics | Rating | Rank | High School Diploma |
| Colombians | 3.8 /100 | #231 | Tragic 88.1% |
| Immigrants | Middle Africa | 3.4 /100 | #232 | Tragic 88.0% |
| Immigrants | Panama | 3.1 /100 | #233 | Tragic 88.0% |
| Immigrants | Thailand | 3.1 /100 | #234 | Tragic 88.0% |
| Immigrants | Bahamas | 2.9 /100 | #235 | Tragic 88.0% |
| Sub-Saharan Africans | 2.8 /100 | #236 | Tragic 87.9% |
| Taiwanese | 2.8 /100 | #237 | Tragic 87.9% |
| Sioux | 2.7 /100 | #238 | Tragic 87.9% |
| South Americans | 2.7 /100 | #239 | Tragic 87.9% |
| Comanche | 2.2 /100 | #240 | Tragic 87.9% |
| Immigrants | Uzbekistan | 2.1 /100 | #241 | Tragic 87.8% |
| Cheyenne | 2.1 /100 | #242 | Tragic 87.8% |
| Immigrants | Philippines | 1.9 /100 | #243 | Tragic 87.8% |
| Choctaw | 1.9 /100 | #244 | Tragic 87.8% |
| Peruvians | 1.9 /100 | #245 | Tragic 87.8% |
| Immigrants | Eritrea | 1.7 /100 | #246 | Tragic 87.8% |
| Immigrants | Costa Rica | 1.7 /100 | #247 | Tragic 87.8% |
| Spanish Americans | 1.5 /100 | #248 | Tragic 87.7% |
| Senegalese | 1.5 /100 | #249 | Tragic 87.7% |
| Immigrants | Nigeria | 1.5 /100 | #250 | Tragic 87.7% |
| Ghanaians | 1.4 /100 | #251 | Tragic 87.7% |