Senegalese vs Immigrants from Ghana 10th Grade
COMPARE
Senegalese
Immigrants from Ghana
10th Grade
10th Grade Comparison
Senegalese
Immigrants from Ghana
93.0%
10TH GRADE
2.4/ 100
METRIC RATING
243rd/ 347
METRIC RANK
92.5%
10TH GRADE
0.3/ 100
METRIC RATING
268th/ 347
METRIC RANK
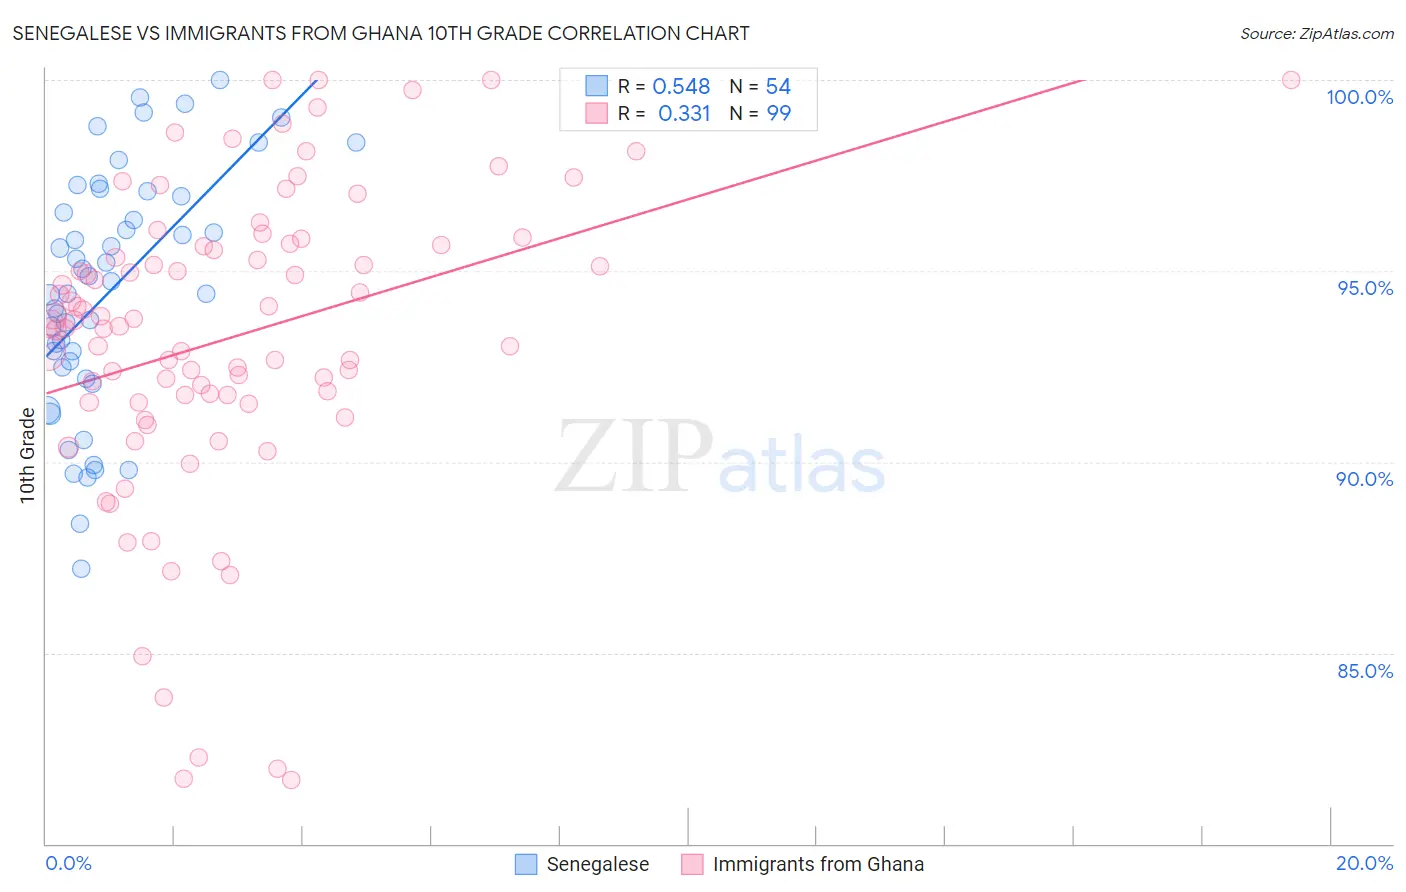
Senegalese vs Immigrants from Ghana 10th Grade Correlation Chart
The statistical analysis conducted on geographies consisting of 78,142,569 people shows a substantial positive correlation between the proportion of Senegalese and percentage of population with at least 10th grade education in the United States with a correlation coefficient (R) of 0.548 and weighted average of 93.0%. Similarly, the statistical analysis conducted on geographies consisting of 199,952,023 people shows a mild positive correlation between the proportion of Immigrants from Ghana and percentage of population with at least 10th grade education in the United States with a correlation coefficient (R) of 0.331 and weighted average of 92.5%, a difference of 0.44%.
10th Grade Correlation Summary
| Measurement | Senegalese | Immigrants from Ghana |
| Minimum | 87.2% | 81.7% |
| Maximum | 100.0% | 100.0% |
| Range | 12.8% | 18.3% |
| Mean | 94.5% | 93.2% |
| Median | 94.6% | 93.6% |
| Interquartile 25% (IQ1) | 92.5% | 91.6% |
| Interquartile 75% (IQ3) | 96.9% | 95.7% |
| Interquartile Range (IQR) | 4.5% | 4.1% |
| Standard Deviation (Sample) | 3.1% | 4.0% |
| Standard Deviation (Population) | 3.1% | 4.0% |
Similar Demographics by 10th Grade
Demographics Similar to Senegalese by 10th Grade
In terms of 10th grade, the demographic groups most similar to Senegalese are Immigrants from Cameroon (93.0%, a difference of 0.020%), Immigrants from Somalia (93.0%, a difference of 0.030%), Spanish American (92.9%, a difference of 0.030%), Uruguayan (92.9%, a difference of 0.060%), and Immigrants from Middle Africa (92.9%, a difference of 0.080%).
| Demographics | Rating | Rank | 10th Grade |
| Afghans | 4.5 /100 | #236 | Tragic 93.1% |
| Immigrants | Panama | 4.3 /100 | #237 | Tragic 93.1% |
| Nigerians | 4.2 /100 | #238 | Tragic 93.1% |
| Costa Ricans | 4.2 /100 | #239 | Tragic 93.1% |
| Immigrants | Hong Kong | 4.2 /100 | #240 | Tragic 93.1% |
| Immigrants | Somalia | 2.7 /100 | #241 | Tragic 93.0% |
| Immigrants | Cameroon | 2.6 /100 | #242 | Tragic 93.0% |
| Senegalese | 2.4 /100 | #243 | Tragic 93.0% |
| Spanish Americans | 2.1 /100 | #244 | Tragic 92.9% |
| Uruguayans | 1.8 /100 | #245 | Tragic 92.9% |
| Immigrants | Middle Africa | 1.7 /100 | #246 | Tragic 92.9% |
| Immigrants | Afghanistan | 1.4 /100 | #247 | Tragic 92.8% |
| Colombians | 1.4 /100 | #248 | Tragic 92.8% |
| Immigrants | Senegal | 1.4 /100 | #249 | Tragic 92.8% |
| Jamaicans | 1.2 /100 | #250 | Tragic 92.8% |
Demographics Similar to Immigrants from Ghana by 10th Grade
In terms of 10th grade, the demographic groups most similar to Immigrants from Ghana are Taiwanese (92.5%, a difference of 0.0%), Dutch West Indian (92.6%, a difference of 0.010%), Immigrants from Philippines (92.6%, a difference of 0.010%), Immigrants from Colombia (92.5%, a difference of 0.020%), and Immigrants from Uruguay (92.5%, a difference of 0.020%).
| Demographics | Rating | Rank | 10th Grade |
| Paiute | 0.4 /100 | #261 | Tragic 92.6% |
| Immigrants | South America | 0.4 /100 | #262 | Tragic 92.6% |
| Apache | 0.4 /100 | #263 | Tragic 92.6% |
| Peruvians | 0.4 /100 | #264 | Tragic 92.6% |
| Dutch West Indians | 0.4 /100 | #265 | Tragic 92.6% |
| Immigrants | Philippines | 0.4 /100 | #266 | Tragic 92.6% |
| Taiwanese | 0.3 /100 | #267 | Tragic 92.5% |
| Immigrants | Ghana | 0.3 /100 | #268 | Tragic 92.5% |
| Immigrants | Colombia | 0.3 /100 | #269 | Tragic 92.5% |
| Immigrants | Uruguay | 0.3 /100 | #270 | Tragic 92.5% |
| Immigrants | Eritrea | 0.3 /100 | #271 | Tragic 92.5% |
| Immigrants | Western Africa | 0.3 /100 | #272 | Tragic 92.5% |
| Trinidadians and Tobagonians | 0.2 /100 | #273 | Tragic 92.4% |
| Immigrants | Congo | 0.2 /100 | #274 | Tragic 92.4% |
| West Indians | 0.2 /100 | #275 | Tragic 92.4% |