Seminole vs Pennsylvania German 12th Grade, No Diploma
COMPARE
Seminole
Pennsylvania German
12th Grade, No Diploma
12th Grade, No Diploma Comparison
Seminole
Pennsylvania Germans
89.4%
12TH GRADE, NO DIPLOMA
0.2/ 100
METRIC RATING
266th/ 347
METRIC RANK
88.7%
12TH GRADE, NO DIPLOMA
0.0/ 100
METRIC RATING
284th/ 347
METRIC RANK
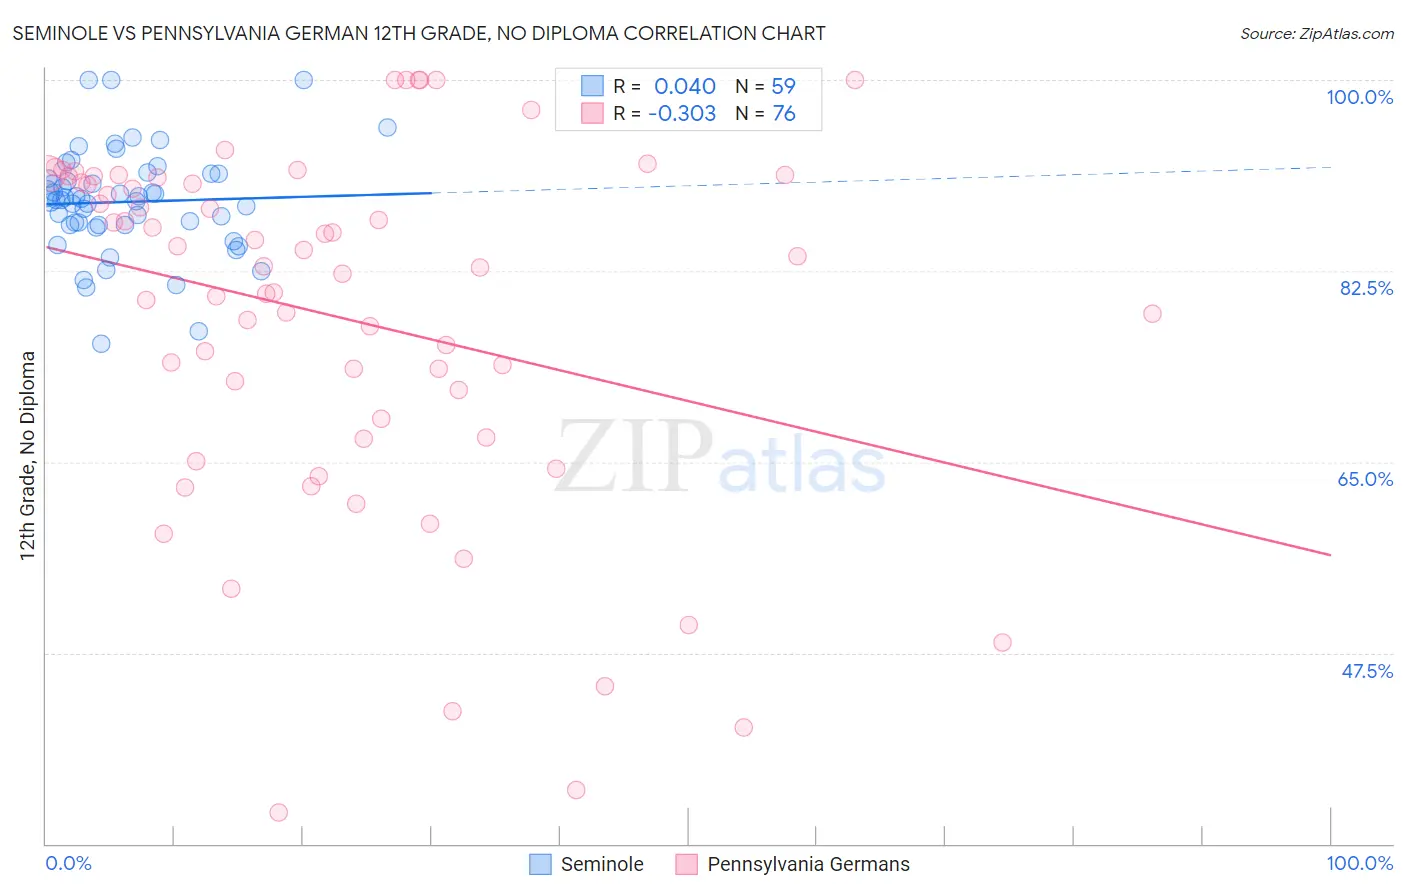
Seminole vs Pennsylvania German 12th Grade, No Diploma Correlation Chart
The statistical analysis conducted on geographies consisting of 118,313,988 people shows no correlation between the proportion of Seminole and percentage of population with at least 12th grade (no diploma) education in the United States with a correlation coefficient (R) of 0.040 and weighted average of 89.4%. Similarly, the statistical analysis conducted on geographies consisting of 234,102,935 people shows a mild negative correlation between the proportion of Pennsylvania Germans and percentage of population with at least 12th grade (no diploma) education in the United States with a correlation coefficient (R) of -0.303 and weighted average of 88.7%, a difference of 0.78%.
12th Grade, No Diploma Correlation Summary
| Measurement | Seminole | Pennsylvania German |
| Minimum | 75.8% | 32.9% |
| Maximum | 100.0% | 100.0% |
| Range | 24.2% | 67.1% |
| Mean | 88.8% | 78.3% |
| Median | 89.0% | 82.9% |
| Interquartile 25% (IQ1) | 86.7% | 68.1% |
| Interquartile 75% (IQ3) | 91.4% | 90.8% |
| Interquartile Range (IQR) | 4.7% | 22.7% |
| Standard Deviation (Sample) | 4.8% | 16.4% |
| Standard Deviation (Population) | 4.7% | 16.3% |
Demographics Similar to Seminole and Pennsylvania Germans by 12th Grade, No Diploma
In terms of 12th grade, no diploma, the demographic groups most similar to Seminole are West Indian (89.3%, a difference of 0.010%), Immigrants from Trinidad and Tobago (89.3%, a difference of 0.030%), U.S. Virgin Islander (89.3%, a difference of 0.060%), Trinidadian and Tobagonian (89.4%, a difference of 0.070%), and Bangladeshi (89.3%, a difference of 0.11%). Similarly, the demographic groups most similar to Pennsylvania Germans are Paiute (88.7%, a difference of 0.010%), Indonesian (88.6%, a difference of 0.020%), Immigrants from Vietnam (88.7%, a difference of 0.070%), Cuban (88.9%, a difference of 0.23%), and Immigrants from Burma/Myanmar (88.9%, a difference of 0.24%).
| Demographics | Rating | Rank | 12th Grade, No Diploma |
| Trinidadians and Tobagonians | 0.2 /100 | #265 | Tragic 89.4% |
| Seminole | 0.2 /100 | #266 | Tragic 89.4% |
| West Indians | 0.2 /100 | #267 | Tragic 89.3% |
| Immigrants | Trinidad and Tobago | 0.1 /100 | #268 | Tragic 89.3% |
| U.S. Virgin Islanders | 0.1 /100 | #269 | Tragic 89.3% |
| Bangladeshis | 0.1 /100 | #270 | Tragic 89.3% |
| Blacks/African Americans | 0.1 /100 | #271 | Tragic 89.3% |
| Malaysians | 0.1 /100 | #272 | Tragic 89.2% |
| Barbadians | 0.1 /100 | #273 | Tragic 89.1% |
| Cajuns | 0.1 /100 | #274 | Tragic 89.1% |
| Immigrants | Congo | 0.1 /100 | #275 | Tragic 89.0% |
| Ute | 0.1 /100 | #276 | Tragic 89.0% |
| Immigrants | Barbados | 0.0 /100 | #277 | Tragic 89.0% |
| Immigrants | St. Vincent and the Grenadines | 0.0 /100 | #278 | Tragic 88.9% |
| Immigrants | Laos | 0.0 /100 | #279 | Tragic 88.9% |
| Immigrants | Burma/Myanmar | 0.0 /100 | #280 | Tragic 88.9% |
| Cubans | 0.0 /100 | #281 | Tragic 88.9% |
| Immigrants | Vietnam | 0.0 /100 | #282 | Tragic 88.7% |
| Paiute | 0.0 /100 | #283 | Tragic 88.7% |
| Pennsylvania Germans | 0.0 /100 | #284 | Tragic 88.7% |
| Indonesians | 0.0 /100 | #285 | Tragic 88.6% |