Scottish vs Immigrants from Sri Lanka Bachelor's Degree

COMPARE

Scottish
Race
Ancestry
AfghanAfricanAlaska NativeAlaskan AthabascanAlbanianAleutAlsatianAmericanApacheArabArapahoArgentineanArmenianAssyrian/Chaldean/SyriacAustralianAustrianBahamianBangladeshiBarbadianBasqueBelgianBelizeanBermudanBhutaneseBlackfeetBolivianBrazilianBritishBritish West IndianBulgarianBurmeseCajunCambodianCanadianCape VerdeanCarpatho RusynCelticCentral AmericanCentral American IndianCherokeeCheyenneChickasawChileanChineseChippewaChoctawColombianColvilleComancheCosta RicanCreeCreekCroatianCrowCubanCypriotCzechCzechoslovakianDanishDelawareDominicanDutchDutch West IndianEastern EuropeanEcuadorianEgyptianEnglishEstonianEthiopianEuropeanFijianFilipinoFinnishFrenchFrench American IndianFrench CanadianGermanGerman RussianGhanaianGreekGuamanian/ChamorroGuatemalanGuyaneseHaitianHmongHonduranHopiHoumaHungarianIcelanderIndian (Asian)IndonesianInupiatIranianIraqiIrishIroquoisIsraeliItalianJamaicanJapaneseJordanianKenyanKiowaKoreanLaotianLatvianLebaneseLiberianLithuanianLumbeeLuxembourgerMacedonianMalaysianMalteseMarshalleseMenomineeMexicanMexican American IndianMongolianMoroccanNative HawaiianNavajoNepaleseNew ZealanderNicaraguanNigerianNorthern EuropeanNorwegianOkinawanOsageOttawaPaiutePakistaniPalestinianPanamanianParaguayanPennsylvania GermanPeruvianPimaPolishPortuguesePotawatomiPuebloPuerto RicanPuget Sound SalishRomanianRussianSalvadoranSamoanScandinavianScotch-IrishScottishSeminoleSenegaleseSerbianShoshoneSierra LeoneanSiouxSlavicSlovakSloveneSomaliSouth AfricanSouth AmericanSouth American IndianSoviet UnionSpaniardSpanishSpanish AmericanSpanish American IndianSri LankanSubsaharan AfricanSudaneseSwedishSwissSyrianTaiwaneseThaiTlingit-HaidaTohono O'OdhamTonganTrinidadian and TobagonianTsimshianTurkishU.S. Virgin IslanderUgandanUkrainianUruguayanUteVenezuelanVietnameseWelshWest IndianYakamaYaquiYugoslavianYumanYup'ikZimbabwean
Immigration
NonimmigrantsImmigrantsAfghanistanAfricaAlbaniaArgentinaArmeniaAsiaAustraliaAustriaBahamasBangladeshBarbadosBelarusBelgiumBelizeBoliviaBosnia and HerzegovinaBrazilBulgariaBurma/MyanmarCabo VerdeCambodiaCameroonCanadaCaribbeanCentral AmericaChileChinaColombiaCongoCosta RicaCroatiaCubaCzechoslovakiaDenmarkDominicaDominican RepublicEastern AfricaEastern AsiaEastern EuropeEcuadorEgyptEl SalvadorEnglandEritreaEthiopiaEuropeFijiFranceGermanyGhanaGreeceGrenadaGuatemalaGuyanaHaitiHondurasHong KongHungaryIndiaIndonesiaIranIraqIrelandIsraelItalyJamaicaJapanJordanKazakhstanKenyaKoreaKuwaitLaosLatin AmericaLatviaLebanonLiberiaLithuaniaMalaysiaMexicoMicronesiaMiddle AfricaMoldovaMoroccoNepalNetherlandsNicaraguaNigeriaNorth AmericaNorth MacedoniaNorthern AfricaNorthern EuropeNorwayOceaniaPakistanPanamaPeruPhilippinesPolandPortugalRomaniaRussiaSaudi ArabiaScotlandSenegalSerbiaSierra LeoneSingaporeSomaliaSouth AfricaSouth AmericaSouth Central AsiaSouth Eastern AsiaSouthern EuropeSpainSt. Vincent and the GrenadinesSudanSwedenSwitzerlandSyriaTaiwanThailandTrinidad and TobagoTurkeyUgandaUkraineUruguayUzbekistanVenezuelaVietnamWest IndiesWestern AfricaWestern AsiaWestern EuropeYemenZaireZimbabweAzores
Immigrants from Sri Lanka
Race
Ancestry
AfghanAfricanAlaska NativeAlaskan AthabascanAlbanianAleutAlsatianAmericanApacheArabArapahoArgentineanArmenianAssyrian/Chaldean/SyriacAustralianAustrianBahamianBangladeshiBarbadianBasqueBelgianBelizeanBermudanBhutaneseBlackfeetBolivianBrazilianBritishBritish West IndianBulgarianBurmeseCajunCambodianCanadianCape VerdeanCarpatho RusynCelticCentral AmericanCentral American IndianCherokeeCheyenneChickasawChileanChineseChippewaChoctawColombianColvilleComancheCosta RicanCreeCreekCroatianCrowCubanCypriotCzechCzechoslovakianDanishDelawareDominicanDutchDutch West IndianEastern EuropeanEcuadorianEgyptianEnglishEstonianEthiopianEuropeanFijianFilipinoFinnishFrenchFrench American IndianFrench CanadianGermanGerman RussianGhanaianGreekGuamanian/ChamorroGuatemalanGuyaneseHaitianHmongHonduranHopiHoumaHungarianIcelanderIndian (Asian)IndonesianInupiatIranianIraqiIrishIroquoisIsraeliItalianJamaicanJapaneseJordanianKenyanKiowaKoreanLaotianLatvianLebaneseLiberianLithuanianLumbeeLuxembourgerMacedonianMalaysianMalteseMarshalleseMenomineeMexicanMexican American IndianMongolianMoroccanNative HawaiianNavajoNepaleseNew ZealanderNicaraguanNigerianNorthern EuropeanNorwegianOkinawanOsageOttawaPaiutePakistaniPalestinianPanamanianParaguayanPennsylvania GermanPeruvianPimaPolishPortuguesePotawatomiPuebloPuerto RicanPuget Sound SalishRomanianRussianSalvadoranSamoanScandinavianScotch-IrishSeminoleSenegaleseSerbianShoshoneSierra LeoneanSiouxSlavicSlovakSloveneSomaliSouth AfricanSouth AmericanSouth American IndianSoviet UnionSpaniardSpanishSpanish AmericanSpanish American IndianSri LankanSubsaharan AfricanSudaneseSwedishSwissSyrianTaiwaneseThaiTlingit-HaidaTohono O'OdhamTonganTrinidadian and TobagonianTsimshianTurkishU.S. Virgin IslanderUgandanUkrainianUruguayanUteVenezuelanVietnameseWelshWest IndianYakamaYaquiYugoslavianYumanYup'ikZimbabwean
Immigration
NonimmigrantsImmigrantsAfghanistanAfricaAlbaniaArgentinaArmeniaAsiaAustraliaAustriaBahamasBangladeshBarbadosBelarusBelgiumBelizeBoliviaBosnia and HerzegovinaBrazilBulgariaBurma/MyanmarCabo VerdeCambodiaCameroonCanadaCaribbeanCentral AmericaChileChinaColombiaCongoCosta RicaCroatiaCubaCzechoslovakiaDenmarkDominicaDominican RepublicEastern AfricaEastern AsiaEastern EuropeEcuadorEgyptEl SalvadorEnglandEritreaEthiopiaEuropeFijiFranceGermanyGhanaGreeceGrenadaGuatemalaGuyanaHaitiHondurasHong KongHungaryIndiaIndonesiaIranIraqIrelandIsraelItalyJamaicaJapanJordanKazakhstanKenyaKoreaKuwaitLaosLatin AmericaLatviaLebanonLiberiaLithuaniaMalaysiaMexicoMicronesiaMiddle AfricaMoldovaMoroccoNepalNetherlandsNicaraguaNigeriaNorth AmericaNorth MacedoniaNorthern AfricaNorthern EuropeNorwayOceaniaPakistanPanamaPeruPhilippinesPolandPortugalRomaniaRussiaSaudi ArabiaScotlandSenegalSerbiaSierra LeoneSingaporeSomaliaSouth AfricaSouth AmericaSouth Central AsiaSouth Eastern AsiaSouthern EuropeSpainSri LankaSt. Vincent and the GrenadinesSudanSwedenSwitzerlandSyriaTaiwanThailandTrinidad and TobagoTurkeyUgandaUkraineUruguayUzbekistanVenezuelaVietnamWest IndiesWestern AfricaWestern AsiaWestern EuropeYemenZaireZimbabweAzores
Bachelor's Degree
Income
Poverty
Unemployment
Labor Participation
Family Structure
Vehicle Availability
Education Level
Disability

Bachelor's Degree Comparison

Scottish

Immigrants from Sri Lanka

Average
Exceptional
38.1%
BACHELOR'S DEGREE
56.6/ 100
METRIC RATING
167th/ 347
METRIC RANK
46.1%
BACHELOR'S DEGREE
100.0/ 100
METRIC RATING
30th/ 347
METRIC RANK

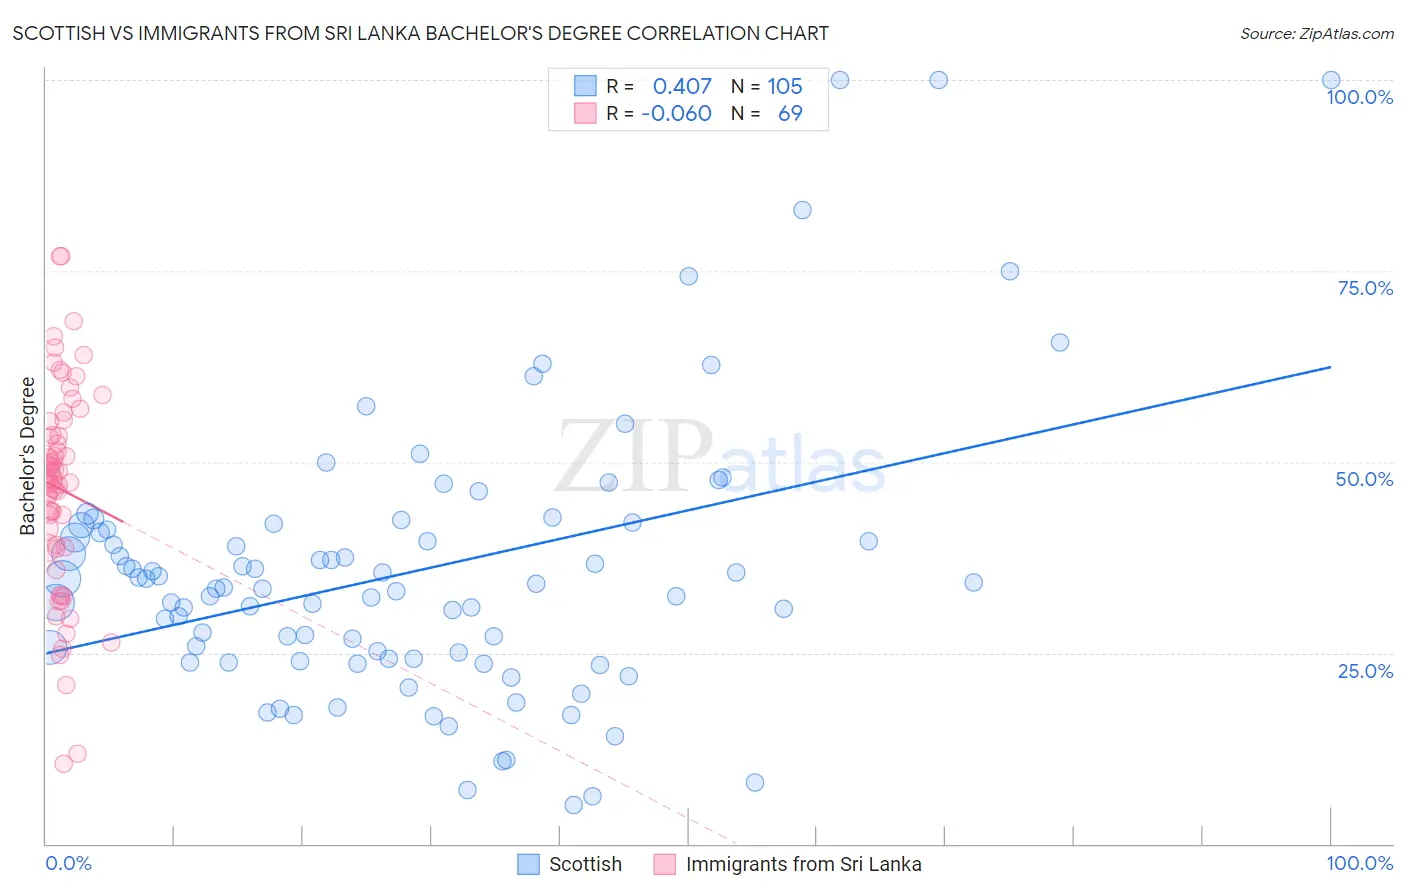
Scottish vs Immigrants from Sri Lanka Bachelor's Degree Correlation Chart

The statistical analysis conducted on geographies consisting of 567,001,084 people shows a moderate positive correlation between the proportion of Scottish and percentage of population with at least bachelor's degree education in the United States with a correlation coefficient (R) of 0.407 and weighted average of 38.1%. Similarly, the statistical analysis conducted on geographies consisting of 149,698,574 people shows a slight negative correlation between the proportion of Immigrants from Sri Lanka and percentage of population with at least bachelor's degree education in the United States with a correlation coefficient (R) of -0.060 and weighted average of 46.1%, a difference of 21.1%.
Scottish vs Immigrants from Sri Lanka Bachelor's Degree

Bachelor's Degree Correlation Summary

MeasurementScottishImmigrants from Sri Lanka
Minimum5.1%10.5%
Maximum100.0%77.0%
Range94.9%66.5%
Mean35.6%46.5%
Median33.5%47.6%
Interquartile 25% (IQ1)24.2%38.7%
Interquartile 75% (IQ3)41.4%54.4%
Interquartile Range (IQR)17.2%15.6%
Standard Deviation (Sample)18.1%13.5%
Standard Deviation (Population)18.0%13.4%

Similar Demographics by Bachelor's Degree

Demographics Similar to Scottish by Bachelor's Degree

In terms of bachelor's degree, the demographic groups most similar to Scottish are Danish (38.1%, a difference of 0.030%), Ghanaian (38.0%, a difference of 0.12%), Somali (38.1%, a difference of 0.21%), Czech (38.0%, a difference of 0.22%), and Bermudan (38.0%, a difference of 0.23%).
DemographicsRating | RankBachelor's Degree
Vietnamese
66.6
/100
|
#160
Good
38.5%
Uruguayans
65.8
/100
|
#161
Good
38.4%
Colombians
65.0
/100
|
#162
Good
38.4%
Peruvians
63.4
/100
|
#163
Good
38.3%
Hungarians
62.1
/100
|
#164
Good
38.3%
Sri Lankans
59.1
/100
|
#165
Average
38.2%
Somalis
58.6
/100
|
#166
Average
38.1%
Scottish
56.6
/100
|
#167
Average
38.1%
Danes
56.2
/100
|
#168
Average
38.1%
Ghanaians
55.3
/100
|
#169
Average
38.0%
Czechs
54.4
/100
|
#170
Average
38.0%
Bermudans
54.2
/100
|
#171
Average
38.0%
Immigrants | Somalia
52.8
/100
|
#172
Average
37.9%
Immigrants | Iraq
52.5
/100
|
#173
Average
37.9%
Immigrants | Bangladesh
50.0
/100
|
#174
Average
37.8%

Demographics Similar to Immigrants from Sri Lanka by Bachelor's Degree

In terms of bachelor's degree, the demographic groups most similar to Immigrants from Sri Lanka are Latvian (46.1%, a difference of 0.040%), Israeli (46.1%, a difference of 0.050%), Turkish (46.2%, a difference of 0.18%), Immigrants from Turkey (46.0%, a difference of 0.34%), and Immigrants from France (46.4%, a difference of 0.64%).
DemographicsRating | RankBachelor's Degree
Immigrants | Sweden
100.0
/100
|
#23
Exceptional
47.0%
Immigrants | Korea
100.0
/100
|
#24
Exceptional
47.0%
Burmese
100.0
/100
|
#25
Exceptional
46.9%
Immigrants | Japan
100.0
/100
|
#26
Exceptional
46.8%
Immigrants | France
100.0
/100
|
#27
Exceptional
46.4%
Turks
100.0
/100
|
#28
Exceptional
46.2%
Israelis
100.0
/100
|
#29
Exceptional
46.1%
Immigrants | Sri Lanka
100.0
/100
|
#30
Exceptional
46.1%
Latvians
100.0
/100
|
#31
Exceptional
46.1%
Immigrants | Turkey
100.0
/100
|
#32
Exceptional
46.0%
Immigrants | Northern Europe
100.0
/100
|
#33
Exceptional
45.6%
Immigrants | Denmark
100.0
/100
|
#34
Exceptional
45.4%
Immigrants | Russia
100.0
/100
|
#35
Exceptional
45.4%
Mongolians
100.0
/100
|
#36
Exceptional
45.4%
Russians
100.0
/100
|
#37
Exceptional
45.3%