Scotch-Irish vs Immigrants from Southern Europe No Schooling Completed
COMPARE
Scotch-Irish
Immigrants from Southern Europe
No Schooling Completed
No Schooling Completed Comparison
Scotch-Irish
Immigrants from Southern Europe
1.5%
NO SCHOOLING COMPLETED
100.0/ 100
METRIC RATING
14th/ 347
METRIC RANK
2.2%
NO SCHOOLING COMPLETED
23.8/ 100
METRIC RATING
197th/ 347
METRIC RANK
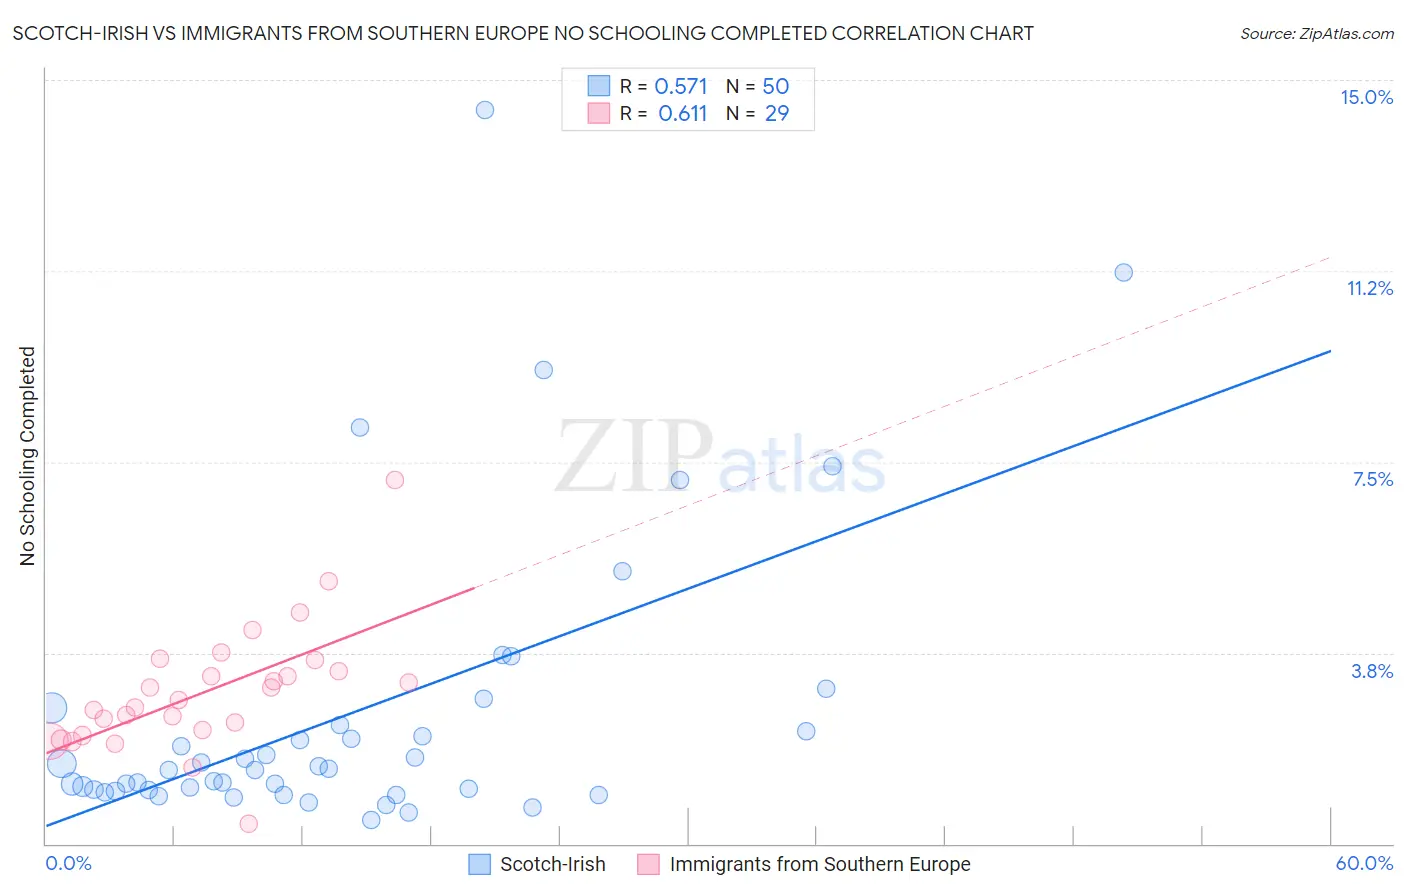
Scotch-Irish vs Immigrants from Southern Europe No Schooling Completed Correlation Chart
The statistical analysis conducted on geographies consisting of 532,641,930 people shows a substantial positive correlation between the proportion of Scotch-Irish and percentage of population with no schooling in the United States with a correlation coefficient (R) of 0.571 and weighted average of 1.5%. Similarly, the statistical analysis conducted on geographies consisting of 398,295,822 people shows a significant positive correlation between the proportion of Immigrants from Southern Europe and percentage of population with no schooling in the United States with a correlation coefficient (R) of 0.611 and weighted average of 2.2%, a difference of 49.7%.
No Schooling Completed Correlation Summary
| Measurement | Scotch-Irish | Immigrants from Southern Europe |
| Minimum | 0.46% | 0.38% |
| Maximum | 14.4% | 7.1% |
| Range | 14.0% | 6.8% |
| Mean | 2.6% | 3.0% |
| Median | 1.5% | 2.8% |
| Interquartile 25% (IQ1) | 1.0% | 2.2% |
| Interquartile 75% (IQ3) | 2.3% | 3.5% |
| Interquartile Range (IQR) | 1.3% | 1.3% |
| Standard Deviation (Sample) | 2.9% | 1.2% |
| Standard Deviation (Population) | 2.9% | 1.2% |
Similar Demographics by No Schooling Completed
Demographics Similar to Scotch-Irish by No Schooling Completed
In terms of no schooling completed, the demographic groups most similar to Scotch-Irish are Tlingit-Haida (1.5%, a difference of 0.060%), Finnish (1.5%, a difference of 0.58%), Croatian (1.5%, a difference of 0.59%), Danish (1.5%, a difference of 0.89%), and Polish (1.4%, a difference of 0.94%).
| Demographics | Rating | Rank | No Schooling Completed |
| English | 100.0 /100 | #7 | Exceptional 1.4% |
| Swedes | 100.0 /100 | #8 | Exceptional 1.4% |
| Scottish | 100.0 /100 | #9 | Exceptional 1.4% |
| Dutch | 100.0 /100 | #10 | Exceptional 1.4% |
| Lithuanians | 100.0 /100 | #11 | Exceptional 1.4% |
| Irish | 100.0 /100 | #12 | Exceptional 1.4% |
| Poles | 100.0 /100 | #13 | Exceptional 1.4% |
| Scotch-Irish | 100.0 /100 | #14 | Exceptional 1.5% |
| Tlingit-Haida | 100.0 /100 | #15 | Exceptional 1.5% |
| Finns | 100.0 /100 | #16 | Exceptional 1.5% |
| Croatians | 100.0 /100 | #17 | Exceptional 1.5% |
| Danes | 100.0 /100 | #18 | Exceptional 1.5% |
| Alaskan Athabascans | 100.0 /100 | #19 | Exceptional 1.5% |
| Welsh | 100.0 /100 | #20 | Exceptional 1.5% |
| Chinese | 100.0 /100 | #21 | Exceptional 1.5% |
Demographics Similar to Immigrants from Southern Europe by No Schooling Completed
In terms of no schooling completed, the demographic groups most similar to Immigrants from Southern Europe are Immigrants from Chile (2.2%, a difference of 0.18%), African (2.2%, a difference of 0.35%), Immigrants from Ukraine (2.2%, a difference of 0.41%), Hawaiian (2.2%, a difference of 0.56%), and Immigrants from Albania (2.2%, a difference of 0.76%).
| Demographics | Rating | Rank | No Schooling Completed |
| Spanish Americans | 32.6 /100 | #190 | Fair 2.1% |
| Bermudans | 30.7 /100 | #191 | Fair 2.1% |
| Guamanians/Chamorros | 29.8 /100 | #192 | Fair 2.2% |
| Paraguayans | 29.3 /100 | #193 | Fair 2.2% |
| Immigrants | Albania | 28.3 /100 | #194 | Fair 2.2% |
| Hawaiians | 27.0 /100 | #195 | Fair 2.2% |
| Immigrants | Ukraine | 26.1 /100 | #196 | Fair 2.2% |
| Immigrants | Southern Europe | 23.8 /100 | #197 | Fair 2.2% |
| Immigrants | Chile | 22.7 /100 | #198 | Fair 2.2% |
| Africans | 21.8 /100 | #199 | Fair 2.2% |
| Immigrants | Northern Africa | 19.5 /100 | #200 | Poor 2.2% |
| Costa Ricans | 17.1 /100 | #201 | Poor 2.2% |
| Moroccans | 13.7 /100 | #202 | Poor 2.2% |
| Laotians | 13.3 /100 | #203 | Poor 2.2% |
| Hopi | 12.9 /100 | #204 | Poor 2.2% |