Scotch-Irish vs Immigrants from Germany Professional Degree
COMPARE
Scotch-Irish
Immigrants from Germany
Professional Degree
Professional Degree Comparison
Scotch-Irish
Immigrants from Germany
4.3%
PROFESSIONAL DEGREE
34.2/ 100
METRIC RATING
186th/ 347
METRIC RANK
4.9%
PROFESSIONAL DEGREE
94.1/ 100
METRIC RATING
122nd/ 347
METRIC RANK
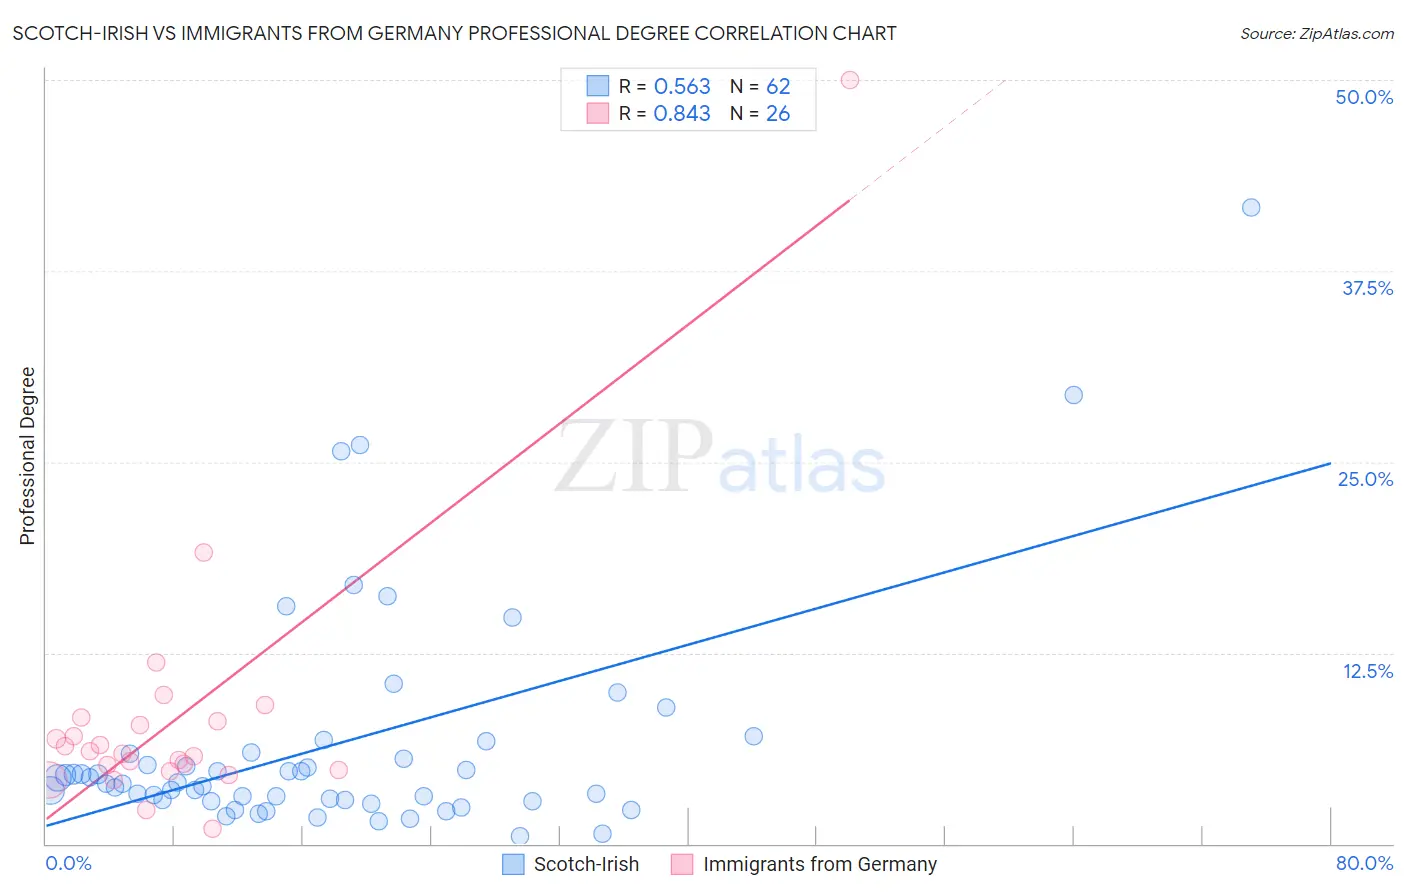
Scotch-Irish vs Immigrants from Germany Professional Degree Correlation Chart
The statistical analysis conducted on geographies consisting of 542,187,635 people shows a substantial positive correlation between the proportion of Scotch-Irish and percentage of population with at least professional degree education in the United States with a correlation coefficient (R) of 0.563 and weighted average of 4.3%. Similarly, the statistical analysis conducted on geographies consisting of 462,387,748 people shows a very strong positive correlation between the proportion of Immigrants from Germany and percentage of population with at least professional degree education in the United States with a correlation coefficient (R) of 0.843 and weighted average of 4.9%, a difference of 12.7%.
Professional Degree Correlation Summary
| Measurement | Scotch-Irish | Immigrants from Germany |
| Minimum | 0.53% | 0.95% |
| Maximum | 41.7% | 50.0% |
| Range | 41.1% | 49.0% |
| Mean | 6.5% | 8.3% |
| Median | 4.0% | 6.0% |
| Interquartile 25% (IQ1) | 2.8% | 4.8% |
| Interquartile 75% (IQ3) | 5.9% | 8.0% |
| Interquartile Range (IQR) | 3.0% | 3.2% |
| Standard Deviation (Sample) | 7.5% | 9.2% |
| Standard Deviation (Population) | 7.4% | 9.0% |
Similar Demographics by Professional Degree
Demographics Similar to Scotch-Irish by Professional Degree
In terms of professional degree, the demographic groups most similar to Scotch-Irish are Immigrants from Cameroon (4.3%, a difference of 0.15%), Welsh (4.3%, a difference of 0.27%), Belgian (4.3%, a difference of 0.32%), Immigrants from Thailand (4.3%, a difference of 0.43%), and Slovak (4.3%, a difference of 0.60%).
| Demographics | Rating | Rank | Professional Degree |
| Immigrants | Kenya | 45.9 /100 | #179 | Average 4.4% |
| Czechs | 44.9 /100 | #180 | Average 4.4% |
| Danes | 43.5 /100 | #181 | Average 4.4% |
| Immigrants | Immigrants | 43.2 /100 | #182 | Average 4.4% |
| Bermudans | 43.1 /100 | #183 | Average 4.4% |
| Belgians | 36.2 /100 | #184 | Fair 4.3% |
| Welsh | 35.8 /100 | #185 | Fair 4.3% |
| Scotch-Irish | 34.2 /100 | #186 | Fair 4.3% |
| Immigrants | Cameroon | 33.3 /100 | #187 | Fair 4.3% |
| Immigrants | Thailand | 31.7 /100 | #188 | Fair 4.3% |
| Slovaks | 30.7 /100 | #189 | Fair 4.3% |
| Immigrants | Poland | 29.2 /100 | #190 | Fair 4.3% |
| Sri Lankans | 29.0 /100 | #191 | Fair 4.3% |
| Ghanaians | 27.3 /100 | #192 | Fair 4.3% |
| French | 27.1 /100 | #193 | Fair 4.2% |
Demographics Similar to Immigrants from Germany by Professional Degree
In terms of professional degree, the demographic groups most similar to Immigrants from Germany are Immigrants from Venezuela (4.8%, a difference of 0.17%), Immigrants from Eritrea (4.8%, a difference of 0.35%), Immigrants from Moldova (4.9%, a difference of 0.46%), Immigrants from Albania (4.8%, a difference of 0.47%), and European (4.8%, a difference of 0.52%).
| Demographics | Rating | Rank | Professional Degree |
| Moroccans | 96.8 /100 | #115 | Exceptional 5.0% |
| Venezuelans | 96.3 /100 | #116 | Exceptional 4.9% |
| Immigrants | Syria | 96.0 /100 | #117 | Exceptional 4.9% |
| Croatians | 96.0 /100 | #118 | Exceptional 4.9% |
| Immigrants | Sudan | 95.4 /100 | #119 | Exceptional 4.9% |
| Albanians | 95.3 /100 | #120 | Exceptional 4.9% |
| Immigrants | Moldova | 94.8 /100 | #121 | Exceptional 4.9% |
| Immigrants | Germany | 94.1 /100 | #122 | Exceptional 4.9% |
| Immigrants | Venezuela | 93.8 /100 | #123 | Exceptional 4.8% |
| Immigrants | Eritrea | 93.5 /100 | #124 | Exceptional 4.8% |
| Immigrants | Albania | 93.3 /100 | #125 | Exceptional 4.8% |
| Europeans | 93.2 /100 | #126 | Exceptional 4.8% |
| Serbians | 92.6 /100 | #127 | Exceptional 4.8% |
| Immigrants | Eastern Africa | 92.5 /100 | #128 | Exceptional 4.8% |
| Palestinians | 91.5 /100 | #129 | Exceptional 4.8% |