Scandinavian vs Immigrants from Turkey 1st Grade
COMPARE
Scandinavian
Immigrants from Turkey
1st Grade
1st Grade Comparison
Scandinavians
Immigrants from Turkey
98.5%
1ST GRADE
100.0/ 100
METRIC RATING
33rd/ 347
METRIC RANK
98.0%
1ST GRADE
82.8/ 100
METRIC RATING
141st/ 347
METRIC RANK
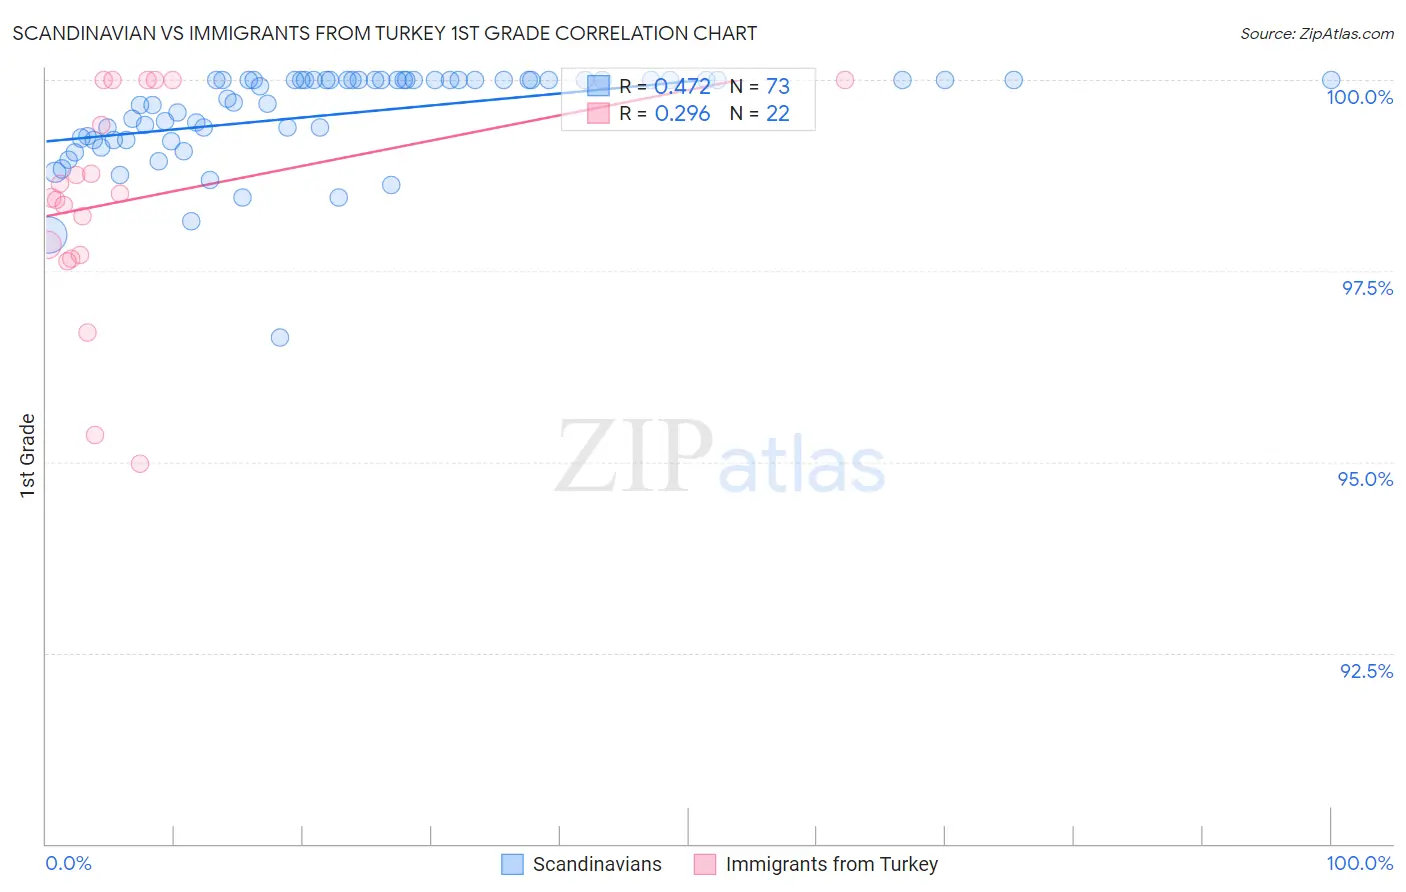
Scandinavian vs Immigrants from Turkey 1st Grade Correlation Chart
The statistical analysis conducted on geographies consisting of 472,660,430 people shows a moderate positive correlation between the proportion of Scandinavians and percentage of population with at least 1st grade education in the United States with a correlation coefficient (R) of 0.472 and weighted average of 98.5%. Similarly, the statistical analysis conducted on geographies consisting of 223,057,877 people shows a weak positive correlation between the proportion of Immigrants from Turkey and percentage of population with at least 1st grade education in the United States with a correlation coefficient (R) of 0.296 and weighted average of 98.0%, a difference of 0.51%.
1st Grade Correlation Summary
| Measurement | Scandinavian | Immigrants from Turkey |
| Minimum | 96.6% | 95.0% |
| Maximum | 100.0% | 100.0% |
| Range | 3.4% | 5.0% |
| Mean | 99.5% | 98.4% |
| Median | 100.0% | 98.5% |
| Interquartile 25% (IQ1) | 99.2% | 97.7% |
| Interquartile 75% (IQ3) | 100.0% | 100.0% |
| Interquartile Range (IQR) | 0.79% | 2.3% |
| Standard Deviation (Sample) | 0.63% | 1.4% |
| Standard Deviation (Population) | 0.63% | 1.4% |
Similar Demographics by 1st Grade
Demographics Similar to Scandinavians by 1st Grade
In terms of 1st grade, the demographic groups most similar to Scandinavians are French Canadian (98.5%, a difference of 0.0%), French (98.6%, a difference of 0.010%), European (98.5%, a difference of 0.010%), Czech (98.5%, a difference of 0.010%), and Croatian (98.6%, a difference of 0.020%).
| Demographics | Rating | Rank | 1st Grade |
| Scotch-Irish | 100.0 /100 | #26 | Exceptional 98.6% |
| Poles | 100.0 /100 | #27 | Exceptional 98.6% |
| Croatians | 100.0 /100 | #28 | Exceptional 98.6% |
| French | 100.0 /100 | #29 | Exceptional 98.6% |
| Europeans | 100.0 /100 | #30 | Exceptional 98.5% |
| Czechs | 100.0 /100 | #31 | Exceptional 98.5% |
| French Canadians | 100.0 /100 | #32 | Exceptional 98.5% |
| Scandinavians | 100.0 /100 | #33 | Exceptional 98.5% |
| Swiss | 100.0 /100 | #34 | Exceptional 98.5% |
| Chinese | 100.0 /100 | #35 | Exceptional 98.5% |
| British | 100.0 /100 | #36 | Exceptional 98.5% |
| Italians | 99.9 /100 | #37 | Exceptional 98.5% |
| Chippewa | 99.9 /100 | #38 | Exceptional 98.5% |
| Latvians | 99.9 /100 | #39 | Exceptional 98.5% |
| Luxembourgers | 99.9 /100 | #40 | Exceptional 98.5% |
Demographics Similar to Immigrants from Turkey by 1st Grade
In terms of 1st grade, the demographic groups most similar to Immigrants from Turkey are Palestinian (98.0%, a difference of 0.0%), Marshallese (98.0%, a difference of 0.0%), Burmese (98.0%, a difference of 0.010%), Alsatian (98.0%, a difference of 0.010%), and Hmong (98.0%, a difference of 0.020%).
| Demographics | Rating | Rank | 1st Grade |
| Immigrants | Hungary | 89.4 /100 | #134 | Excellent 98.1% |
| Immigrants | Kuwait | 89.3 /100 | #135 | Excellent 98.1% |
| Immigrants | Bulgaria | 88.8 /100 | #136 | Excellent 98.1% |
| Israelis | 87.8 /100 | #137 | Excellent 98.1% |
| Immigrants | Romania | 87.8 /100 | #138 | Excellent 98.1% |
| Blackfeet | 87.6 /100 | #139 | Excellent 98.1% |
| Palestinians | 83.0 /100 | #140 | Excellent 98.0% |
| Immigrants | Turkey | 82.8 /100 | #141 | Excellent 98.0% |
| Marshallese | 82.0 /100 | #142 | Excellent 98.0% |
| Burmese | 81.0 /100 | #143 | Excellent 98.0% |
| Alsatians | 80.9 /100 | #144 | Excellent 98.0% |
| Hmong | 79.0 /100 | #145 | Good 98.0% |
| Immigrants | Israel | 77.8 /100 | #146 | Good 98.0% |
| Filipinos | 77.6 /100 | #147 | Good 98.0% |
| Apache | 75.2 /100 | #148 | Good 98.0% |