Samoan vs Native/Alaskan 4th Grade

COMPARE

Samoan
Race
Ancestry
AfghanAfricanAlaska NativeAlaskan AthabascanAlbanianAleutAlsatianAmericanApacheArabArapahoArgentineanArmenianAssyrian/Chaldean/SyriacAustralianAustrianBahamianBangladeshiBarbadianBasqueBelgianBelizeanBermudanBhutaneseBlackfeetBolivianBrazilianBritishBritish West IndianBulgarianBurmeseCajunCambodianCanadianCape VerdeanCarpatho RusynCelticCentral AmericanCentral American IndianCherokeeCheyenneChickasawChileanChineseChippewaChoctawColombianColvilleComancheCosta RicanCreeCreekCroatianCrowCubanCypriotCzechCzechoslovakianDanishDelawareDominicanDutchDutch West IndianEastern EuropeanEcuadorianEgyptianEnglishEstonianEthiopianEuropeanFijianFilipinoFinnishFrenchFrench American IndianFrench CanadianGermanGerman RussianGhanaianGreekGuamanian/ChamorroGuatemalanGuyaneseHaitianHmongHonduranHopiHoumaHungarianIcelanderIndian (Asian)IndonesianInupiatIranianIraqiIrishIroquoisIsraeliItalianJamaicanJapaneseJordanianKenyanKiowaKoreanLaotianLatvianLebaneseLiberianLithuanianLumbeeLuxembourgerMacedonianMalaysianMalteseMarshalleseMenomineeMexicanMexican American IndianMongolianMoroccanNative HawaiianNavajoNepaleseNew ZealanderNicaraguanNigerianNorthern EuropeanNorwegianOkinawanOsageOttawaPaiutePakistaniPalestinianPanamanianParaguayanPennsylvania GermanPeruvianPimaPolishPortuguesePotawatomiPuebloPuerto RicanPuget Sound SalishRomanianRussianSalvadoranSamoanScandinavianScotch-IrishScottishSeminoleSenegaleseSerbianShoshoneSierra LeoneanSiouxSlavicSlovakSloveneSomaliSouth AfricanSouth AmericanSouth American IndianSoviet UnionSpaniardSpanishSpanish AmericanSpanish American IndianSri LankanSubsaharan AfricanSudaneseSwedishSwissSyrianTaiwaneseThaiTlingit-HaidaTohono O'OdhamTonganTrinidadian and TobagonianTsimshianTurkishU.S. Virgin IslanderUgandanUkrainianUruguayanUteVenezuelanVietnameseWelshWest IndianYakamaYaquiYugoslavianYumanYup'ikZimbabwean
Immigration
NonimmigrantsImmigrantsAfghanistanAfricaAlbaniaArgentinaArmeniaAsiaAustraliaAustriaBahamasBangladeshBarbadosBelarusBelgiumBelizeBoliviaBosnia and HerzegovinaBrazilBulgariaBurma/MyanmarCabo VerdeCambodiaCameroonCanadaCaribbeanCentral AmericaChileChinaColombiaCongoCosta RicaCroatiaCubaCzechoslovakiaDenmarkDominicaDominican RepublicEastern AfricaEastern AsiaEastern EuropeEcuadorEgyptEl SalvadorEnglandEritreaEthiopiaEuropeFijiFranceGermanyGhanaGreeceGrenadaGuatemalaGuyanaHaitiHondurasHong KongHungaryIndiaIndonesiaIranIraqIrelandIsraelItalyJamaicaJapanJordanKazakhstanKenyaKoreaKuwaitLaosLatin AmericaLatviaLebanonLiberiaLithuaniaMalaysiaMexicoMicronesiaMiddle AfricaMoldovaMoroccoNepalNetherlandsNicaraguaNigeriaNorth AmericaNorth MacedoniaNorthern AfricaNorthern EuropeNorwayOceaniaPakistanPanamaPeruPhilippinesPolandPortugalRomaniaRussiaSaudi ArabiaScotlandSenegalSerbiaSierra LeoneSingaporeSomaliaSouth AfricaSouth AmericaSouth Central AsiaSouth Eastern AsiaSouthern EuropeSpainSri LankaSt. Vincent and the GrenadinesSudanSwedenSwitzerlandSyriaTaiwanThailandTrinidad and TobagoTurkeyUgandaUkraineUruguayUzbekistanVenezuelaVietnamWest IndiesWestern AfricaWestern AsiaWestern EuropeYemenZaireZimbabweAzores
Native/Alaskan
Race
Ancestry
AfghanAfricanAlaska NativeAlaskan AthabascanAlbanianAleutAlsatianAmericanApacheArabArapahoArgentineanArmenianAssyrian/Chaldean/SyriacAustralianAustrianBahamianBangladeshiBarbadianBasqueBelgianBelizeanBermudanBhutaneseBlackfeetBolivianBrazilianBritishBritish West IndianBulgarianBurmeseCajunCambodianCanadianCape VerdeanCarpatho RusynCelticCentral AmericanCentral American IndianCherokeeCheyenneChickasawChileanChineseChippewaChoctawColombianColvilleComancheCosta RicanCreeCreekCroatianCrowCubanCypriotCzechCzechoslovakianDanishDelawareDominicanDutchDutch West IndianEastern EuropeanEcuadorianEgyptianEnglishEstonianEthiopianEuropeanFijianFilipinoFinnishFrenchFrench American IndianFrench CanadianGermanGerman RussianGhanaianGreekGuamanian/ChamorroGuatemalanGuyaneseHaitianHmongHonduranHopiHoumaHungarianIcelanderIndian (Asian)IndonesianInupiatIranianIraqiIrishIroquoisIsraeliItalianJamaicanJapaneseJordanianKenyanKiowaKoreanLaotianLatvianLebaneseLiberianLithuanianLumbeeLuxembourgerMacedonianMalaysianMalteseMarshalleseMenomineeMexicanMexican American IndianMongolianMoroccanNative HawaiianNavajoNepaleseNew ZealanderNicaraguanNigerianNorthern EuropeanNorwegianOkinawanOsageOttawaPaiutePakistaniPalestinianPanamanianParaguayanPennsylvania GermanPeruvianPimaPolishPortuguesePotawatomiPuebloPuerto RicanPuget Sound SalishRomanianRussianSalvadoranScandinavianScotch-IrishScottishSeminoleSenegaleseSerbianShoshoneSierra LeoneanSiouxSlavicSlovakSloveneSomaliSouth AfricanSouth AmericanSouth American IndianSoviet UnionSpaniardSpanishSpanish AmericanSpanish American IndianSri LankanSubsaharan AfricanSudaneseSwedishSwissSyrianTaiwaneseThaiTlingit-HaidaTohono O'OdhamTonganTrinidadian and TobagonianTsimshianTurkishU.S. Virgin IslanderUgandanUkrainianUruguayanUteVenezuelanVietnameseWelshWest IndianYakamaYaquiYugoslavianYumanYup'ikZimbabwean
Immigration
NonimmigrantsImmigrantsAfghanistanAfricaAlbaniaArgentinaArmeniaAsiaAustraliaAustriaBahamasBangladeshBarbadosBelarusBelgiumBelizeBoliviaBosnia and HerzegovinaBrazilBulgariaBurma/MyanmarCabo VerdeCambodiaCameroonCanadaCaribbeanCentral AmericaChileChinaColombiaCongoCosta RicaCroatiaCubaCzechoslovakiaDenmarkDominicaDominican RepublicEastern AfricaEastern AsiaEastern EuropeEcuadorEgyptEl SalvadorEnglandEritreaEthiopiaEuropeFijiFranceGermanyGhanaGreeceGrenadaGuatemalaGuyanaHaitiHondurasHong KongHungaryIndiaIndonesiaIranIraqIrelandIsraelItalyJamaicaJapanJordanKazakhstanKenyaKoreaKuwaitLaosLatin AmericaLatviaLebanonLiberiaLithuaniaMalaysiaMexicoMicronesiaMiddle AfricaMoldovaMoroccoNepalNetherlandsNicaraguaNigeriaNorth AmericaNorth MacedoniaNorthern AfricaNorthern EuropeNorwayOceaniaPakistanPanamaPeruPhilippinesPolandPortugalRomaniaRussiaSaudi ArabiaScotlandSenegalSerbiaSierra LeoneSingaporeSomaliaSouth AfricaSouth AmericaSouth Central AsiaSouth Eastern AsiaSouthern EuropeSpainSri LankaSt. Vincent and the GrenadinesSudanSwedenSwitzerlandSyriaTaiwanThailandTrinidad and TobagoTurkeyUgandaUkraineUruguayUzbekistanVenezuelaVietnamWest IndiesWestern AfricaWestern AsiaWestern EuropeYemenZaireZimbabweAzores
4th Grade
Income
Poverty
Unemployment
Labor Participation
Family Structure
Vehicle Availability
Education Level
Disability

4th Grade Comparison

Samoans

Natives/Alaskans

Tragic
Fair
97.3%
4TH GRADE
6.8/ 100
METRIC RATING
216th/ 347
METRIC RANK
97.4%
4TH GRADE
20.6/ 100
METRIC RATING
199th/ 347
METRIC RANK

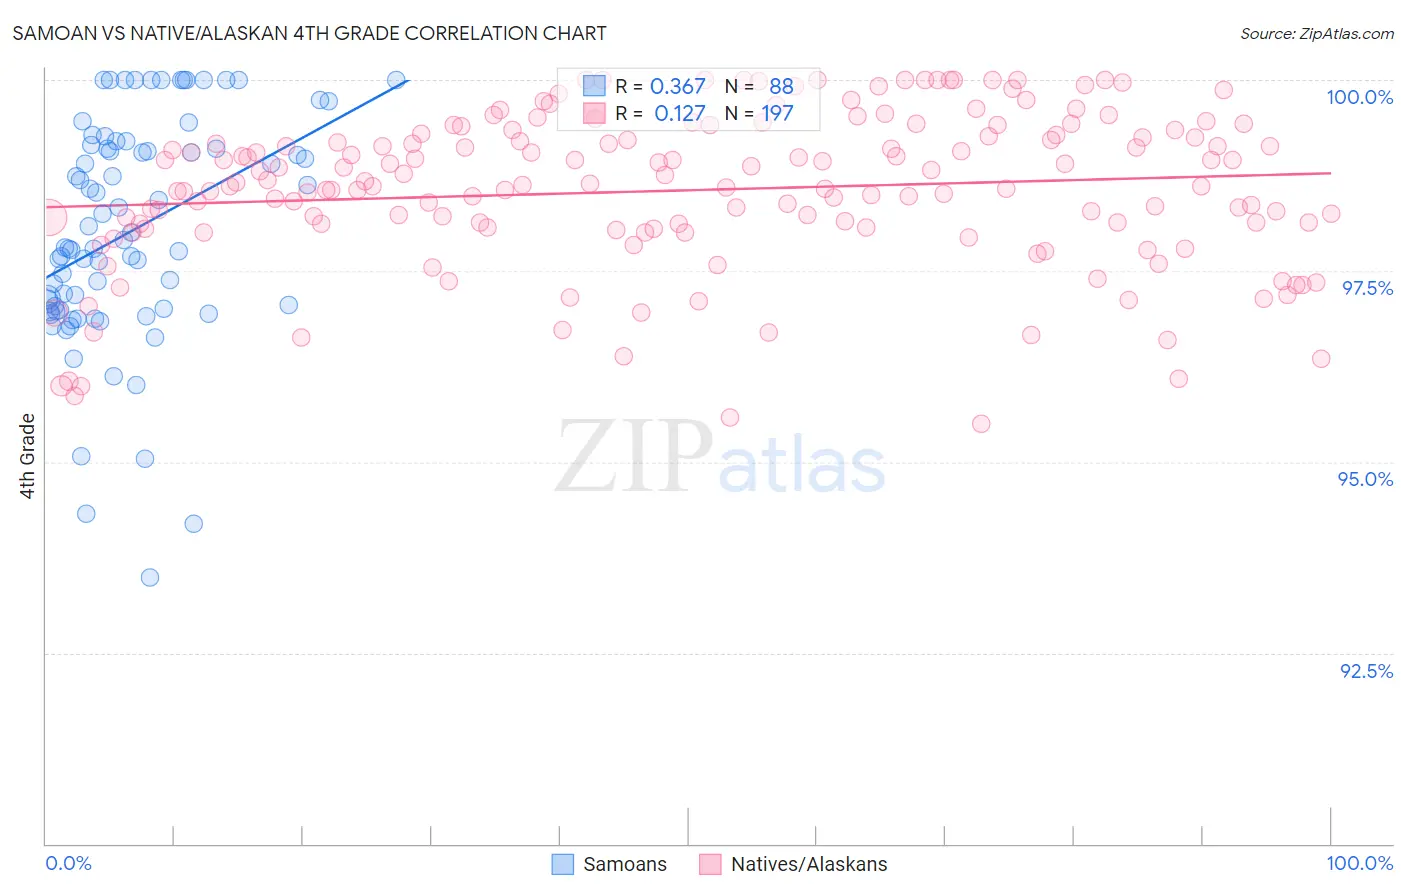
Samoan vs Native/Alaskan 4th Grade Correlation Chart

The statistical analysis conducted on geographies consisting of 225,205,818 people shows a mild positive correlation between the proportion of Samoans and percentage of population with at least 4th grade education in the United States with a correlation coefficient (R) of 0.367 and weighted average of 97.3%. Similarly, the statistical analysis conducted on geographies consisting of 513,056,654 people shows a poor positive correlation between the proportion of Natives/Alaskans and percentage of population with at least 4th grade education in the United States with a correlation coefficient (R) of 0.127 and weighted average of 97.4%, a difference of 0.12%.
Samoan vs Native/Alaskan 4th Grade

4th Grade Correlation Summary

MeasurementSamoanNative/Alaskan
Minimum93.5%95.5%
Maximum100.0%100.0%
Range6.5%4.5%
Mean98.0%98.6%
Median97.9%98.6%
Interquartile 25% (IQ1)97.0%98.1%
Interquartile 75% (IQ3)99.1%99.3%
Interquartile Range (IQR)2.1%1.2%
Standard Deviation (Sample)1.5%1.0%
Standard Deviation (Population)1.5%1.0%

Demographics Similar to Samoans and Natives/Alaskans by 4th Grade

In terms of 4th grade, the demographic groups most similar to Samoans are Immigrants from Morocco (97.3%, a difference of 0.0%), Sierra Leonean (97.3%, a difference of 0.0%), Immigrants from Nepal (97.3%, a difference of 0.010%), Tohono O'odham (97.3%, a difference of 0.020%), and Costa Rican (97.3%, a difference of 0.020%). Similarly, the demographic groups most similar to Natives/Alaskans are Guamanian/Chamorro (97.4%, a difference of 0.010%), Immigrants from Uganda (97.4%, a difference of 0.010%), Hawaiian (97.4%, a difference of 0.030%), Immigrants from Southern Europe (97.4%, a difference of 0.030%), and Immigrants from Chile (97.4%, a difference of 0.030%).
DemographicsRating | Rank4th Grade
Hawaiians
25.6
/100
|
#197
Fair
97.4%
Guamanians/Chamorros
23.0
/100
|
#198
Fair
97.4%
Natives/Alaskans
20.6
/100
|
#199
Fair
97.4%
Immigrants | Uganda
19.8
/100
|
#200
Poor
97.4%
Immigrants | Southern Europe
16.2
/100
|
#201
Poor
97.4%
Immigrants | Chile
16.1
/100
|
#202
Poor
97.4%
Immigrants | Northern Africa
15.1
/100
|
#203
Poor
97.4%
Africans
14.6
/100
|
#204
Poor
97.4%
Paiute
13.2
/100
|
#205
Poor
97.3%
Immigrants | Zaire
12.8
/100
|
#206
Poor
97.3%
Moroccans
11.3
/100
|
#207
Poor
97.3%
Immigrants | Bahamas
10.8
/100
|
#208
Poor
97.3%
Laotians
9.3
/100
|
#209
Tragic
97.3%
Immigrants | Oceania
9.1
/100
|
#210
Tragic
97.3%
Sudanese
9.0
/100
|
#211
Tragic
97.3%
Tohono O'odham
8.4
/100
|
#212
Tragic
97.3%
Costa Ricans
8.3
/100
|
#213
Tragic
97.3%
Immigrants | Nepal
7.7
/100
|
#214
Tragic
97.3%
Immigrants | Morocco
7.1
/100
|
#215
Tragic
97.3%
Samoans
6.8
/100
|
#216
Tragic
97.3%
Sierra Leoneans
6.5
/100
|
#217
Tragic
97.3%