Samoan vs Immigrants from Nigeria 10th Grade

COMPARE

Samoan
Race
Ancestry
AfghanAfricanAlaska NativeAlaskan AthabascanAlbanianAleutAlsatianAmericanApacheArabArapahoArgentineanArmenianAssyrian/Chaldean/SyriacAustralianAustrianBahamianBangladeshiBarbadianBasqueBelgianBelizeanBermudanBhutaneseBlackfeetBolivianBrazilianBritishBritish West IndianBulgarianBurmeseCajunCambodianCanadianCape VerdeanCarpatho RusynCelticCentral AmericanCentral American IndianCherokeeCheyenneChickasawChileanChineseChippewaChoctawColombianColvilleComancheCosta RicanCreeCreekCroatianCrowCubanCypriotCzechCzechoslovakianDanishDelawareDominicanDutchDutch West IndianEastern EuropeanEcuadorianEgyptianEnglishEstonianEthiopianEuropeanFijianFilipinoFinnishFrenchFrench American IndianFrench CanadianGermanGerman RussianGhanaianGreekGuamanian/ChamorroGuatemalanGuyaneseHaitianHmongHonduranHopiHoumaHungarianIcelanderIndian (Asian)IndonesianInupiatIranianIraqiIrishIroquoisIsraeliItalianJamaicanJapaneseJordanianKenyanKiowaKoreanLaotianLatvianLebaneseLiberianLithuanianLumbeeLuxembourgerMacedonianMalaysianMalteseMarshalleseMenomineeMexicanMexican American IndianMongolianMoroccanNative HawaiianNavajoNepaleseNew ZealanderNicaraguanNigerianNorthern EuropeanNorwegianOkinawanOsageOttawaPaiutePakistaniPalestinianPanamanianParaguayanPennsylvania GermanPeruvianPimaPolishPortuguesePotawatomiPuebloPuerto RicanPuget Sound SalishRomanianRussianSalvadoranSamoanScandinavianScotch-IrishScottishSeminoleSenegaleseSerbianShoshoneSierra LeoneanSiouxSlavicSlovakSloveneSomaliSouth AfricanSouth AmericanSouth American IndianSoviet UnionSpaniardSpanishSpanish AmericanSpanish American IndianSri LankanSubsaharan AfricanSudaneseSwedishSwissSyrianTaiwaneseThaiTlingit-HaidaTohono O'OdhamTonganTrinidadian and TobagonianTsimshianTurkishU.S. Virgin IslanderUgandanUkrainianUruguayanUteVenezuelanVietnameseWelshWest IndianYakamaYaquiYugoslavianYumanYup'ikZimbabwean
Immigration
NonimmigrantsImmigrantsAfghanistanAfricaAlbaniaArgentinaArmeniaAsiaAustraliaAustriaBahamasBangladeshBarbadosBelarusBelgiumBelizeBoliviaBosnia and HerzegovinaBrazilBulgariaBurma/MyanmarCabo VerdeCambodiaCameroonCanadaCaribbeanCentral AmericaChileChinaColombiaCongoCosta RicaCroatiaCubaCzechoslovakiaDenmarkDominicaDominican RepublicEastern AfricaEastern AsiaEastern EuropeEcuadorEgyptEl SalvadorEnglandEritreaEthiopiaEuropeFijiFranceGermanyGhanaGreeceGrenadaGuatemalaGuyanaHaitiHondurasHong KongHungaryIndiaIndonesiaIranIraqIrelandIsraelItalyJamaicaJapanJordanKazakhstanKenyaKoreaKuwaitLaosLatin AmericaLatviaLebanonLiberiaLithuaniaMalaysiaMexicoMicronesiaMiddle AfricaMoldovaMoroccoNepalNetherlandsNicaraguaNorth AmericaNorth MacedoniaNorthern AfricaNorthern EuropeNorwayOceaniaPakistanPanamaPeruPhilippinesPolandPortugalRomaniaRussiaSaudi ArabiaScotlandSenegalSerbiaSierra LeoneSingaporeSomaliaSouth AfricaSouth AmericaSouth Central AsiaSouth Eastern AsiaSouthern EuropeSpainSri LankaSt. Vincent and the GrenadinesSudanSwedenSwitzerlandSyriaTaiwanThailandTrinidad and TobagoTurkeyUgandaUkraineUruguayUzbekistanVenezuelaVietnamWest IndiesWestern AfricaWestern AsiaWestern EuropeYemenZaireZimbabweAzores
Immigrants from Nigeria
Race
Ancestry
AfghanAfricanAlaska NativeAlaskan AthabascanAlbanianAleutAlsatianAmericanApacheArabArapahoArgentineanArmenianAssyrian/Chaldean/SyriacAustralianAustrianBahamianBangladeshiBarbadianBasqueBelgianBelizeanBermudanBhutaneseBlackfeetBolivianBrazilianBritishBritish West IndianBulgarianBurmeseCajunCambodianCanadianCape VerdeanCarpatho RusynCelticCentral AmericanCentral American IndianCherokeeCheyenneChickasawChileanChineseChippewaChoctawColombianColvilleComancheCosta RicanCreeCreekCroatianCrowCubanCypriotCzechCzechoslovakianDanishDelawareDominicanDutchDutch West IndianEastern EuropeanEcuadorianEgyptianEnglishEstonianEthiopianEuropeanFijianFilipinoFinnishFrenchFrench American IndianFrench CanadianGermanGerman RussianGhanaianGreekGuamanian/ChamorroGuatemalanGuyaneseHaitianHmongHonduranHopiHoumaHungarianIcelanderIndian (Asian)IndonesianInupiatIranianIraqiIrishIroquoisIsraeliItalianJamaicanJapaneseJordanianKenyanKiowaKoreanLaotianLatvianLebaneseLiberianLithuanianLumbeeLuxembourgerMacedonianMalaysianMalteseMarshalleseMenomineeMexicanMexican American IndianMongolianMoroccanNative HawaiianNavajoNepaleseNew ZealanderNicaraguanNigerianNorthern EuropeanNorwegianOkinawanOsageOttawaPaiutePakistaniPalestinianPanamanianParaguayanPennsylvania GermanPeruvianPimaPolishPortuguesePotawatomiPuebloPuerto RicanPuget Sound SalishRomanianRussianSalvadoranScandinavianScotch-IrishScottishSeminoleSenegaleseSerbianShoshoneSierra LeoneanSiouxSlavicSlovakSloveneSomaliSouth AfricanSouth AmericanSouth American IndianSoviet UnionSpaniardSpanishSpanish AmericanSpanish American IndianSri LankanSubsaharan AfricanSudaneseSwedishSwissSyrianTaiwaneseThaiTlingit-HaidaTohono O'OdhamTonganTrinidadian and TobagonianTsimshianTurkishU.S. Virgin IslanderUgandanUkrainianUruguayanUteVenezuelanVietnameseWelshWest IndianYakamaYaquiYugoslavianYumanYup'ikZimbabwean
Immigration
NonimmigrantsImmigrantsAfghanistanAfricaAlbaniaArgentinaArmeniaAsiaAustraliaAustriaBahamasBangladeshBarbadosBelarusBelgiumBelizeBoliviaBosnia and HerzegovinaBrazilBulgariaBurma/MyanmarCabo VerdeCambodiaCameroonCanadaCaribbeanCentral AmericaChileChinaColombiaCongoCosta RicaCroatiaCubaCzechoslovakiaDenmarkDominicaDominican RepublicEastern AfricaEastern AsiaEastern EuropeEcuadorEgyptEl SalvadorEnglandEritreaEthiopiaEuropeFijiFranceGermanyGhanaGreeceGrenadaGuatemalaGuyanaHaitiHondurasHong KongHungaryIndiaIndonesiaIranIraqIrelandIsraelItalyJamaicaJapanJordanKazakhstanKenyaKoreaKuwaitLaosLatin AmericaLatviaLebanonLiberiaLithuaniaMalaysiaMexicoMicronesiaMiddle AfricaMoldovaMoroccoNepalNetherlandsNicaraguaNigeriaNorth AmericaNorth MacedoniaNorthern AfricaNorthern EuropeNorwayOceaniaPakistanPanamaPeruPhilippinesPolandPortugalRomaniaRussiaSaudi ArabiaScotlandSenegalSerbiaSierra LeoneSingaporeSomaliaSouth AfricaSouth AmericaSouth Central AsiaSouth Eastern AsiaSouthern EuropeSpainSri LankaSt. Vincent and the GrenadinesSudanSwedenSwitzerlandSyriaTaiwanThailandTrinidad and TobagoTurkeyUgandaUkraineUruguayUzbekistanVenezuelaVietnamWest IndiesWestern AfricaWestern AsiaWestern EuropeYemenZaireZimbabweAzores
10th Grade
Income
Poverty
Unemployment
Labor Participation
Family Structure
Vehicle Availability
Education Level
Disability

10th Grade Comparison

Samoans

Immigrants from Nigeria

Poor
Tragic
93.4%
10TH GRADE
19.5/ 100
METRIC RATING
207th/ 347
METRIC RANK
92.7%
10TH GRADE
0.7/ 100
METRIC RATING
256th/ 347
METRIC RANK

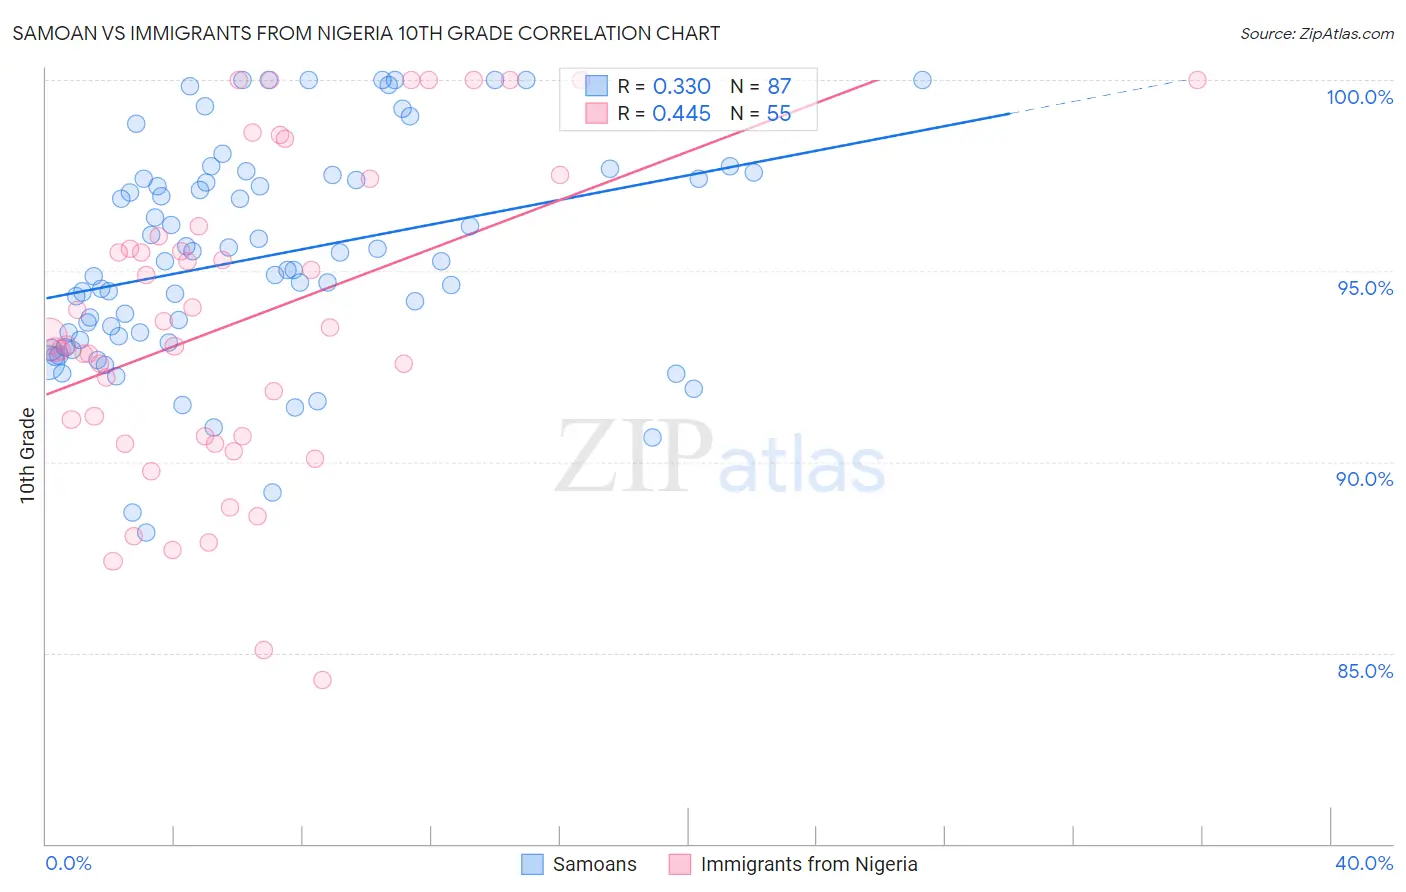
Samoan vs Immigrants from Nigeria 10th Grade Correlation Chart

The statistical analysis conducted on geographies consisting of 225,201,909 people shows a mild positive correlation between the proportion of Samoans and percentage of population with at least 10th grade education in the United States with a correlation coefficient (R) of 0.330 and weighted average of 93.4%. Similarly, the statistical analysis conducted on geographies consisting of 283,441,873 people shows a moderate positive correlation between the proportion of Immigrants from Nigeria and percentage of population with at least 10th grade education in the United States with a correlation coefficient (R) of 0.445 and weighted average of 92.7%, a difference of 0.80%.
Samoan vs Immigrants from Nigeria 10th Grade

10th Grade Correlation Summary

MeasurementSamoanImmigrants from Nigeria
Minimum88.1%84.3%
Maximum100.0%100.0%
Range11.9%15.7%
Mean95.4%93.7%
Median95.2%93.3%
Interquartile 25% (IQ1)93.2%90.7%
Interquartile 75% (IQ3)97.4%96.2%
Interquartile Range (IQR)4.2%5.5%
Standard Deviation (Sample)2.9%4.1%
Standard Deviation (Population)2.8%4.1%

Similar Demographics by 10th Grade

Demographics Similar to Samoans by 10th Grade

In terms of 10th grade, the demographic groups most similar to Samoans are Immigrants from Syria (93.4%, a difference of 0.0%), Immigrants from Western Asia (93.4%, a difference of 0.010%), Ute (93.4%, a difference of 0.010%), Immigrants from Indonesia (93.4%, a difference of 0.010%), and Immigrants from Sudan (93.4%, a difference of 0.010%).
DemographicsRating | Rank10th Grade
Hopi
22.2
/100
|
#200
Fair
93.5%
Hawaiians
21.8
/100
|
#201
Fair
93.5%
Immigrants | Uganda
20.9
/100
|
#202
Fair
93.5%
Immigrants | Western Asia
20.6
/100
|
#203
Fair
93.4%
Ute
20.3
/100
|
#204
Fair
93.4%
Immigrants | Indonesia
20.2
/100
|
#205
Fair
93.4%
Immigrants | Sudan
20.0
/100
|
#206
Fair
93.4%
Samoans
19.5
/100
|
#207
Poor
93.4%
Immigrants | Syria
19.4
/100
|
#208
Poor
93.4%
Immigrants | Chile
18.8
/100
|
#209
Poor
93.4%
Indians (Asian)
17.6
/100
|
#210
Poor
93.4%
Cajuns
16.9
/100
|
#211
Poor
93.4%
Immigrants | Zaire
16.7
/100
|
#212
Poor
93.4%
Immigrants | Asia
15.7
/100
|
#213
Poor
93.4%
Immigrants | Bahamas
15.2
/100
|
#214
Poor
93.4%

Demographics Similar to Immigrants from Nigeria by 10th Grade

In terms of 10th grade, the demographic groups most similar to Immigrants from Nigeria are Immigrants from Bolivia (92.7%, a difference of 0.010%), U.S. Virgin Islander (92.7%, a difference of 0.010%), Immigrants from Costa Rica (92.7%, a difference of 0.020%), Armenian (92.7%, a difference of 0.060%), and Immigrants from Jamaica (92.6%, a difference of 0.060%).
DemographicsRating | Rank10th Grade
Immigrants | Senegal
1.4
/100
|
#249
Tragic
92.8%
Jamaicans
1.2
/100
|
#250
Tragic
92.8%
Immigrants | Thailand
1.0
/100
|
#251
Tragic
92.8%
South Americans
0.9
/100
|
#252
Tragic
92.8%
Ghanaians
0.9
/100
|
#253
Tragic
92.8%
Armenians
0.9
/100
|
#254
Tragic
92.7%
Immigrants | Bolivia
0.7
/100
|
#255
Tragic
92.7%
Immigrants | Nigeria
0.7
/100
|
#256
Tragic
92.7%
U.S. Virgin Islanders
0.7
/100
|
#257
Tragic
92.7%
Immigrants | Costa Rica
0.6
/100
|
#258
Tragic
92.7%
Immigrants | Jamaica
0.5
/100
|
#259
Tragic
92.6%
Immigrants | Uzbekistan
0.5
/100
|
#260
Tragic
92.6%
Paiute
0.4
/100
|
#261
Tragic
92.6%
Immigrants | South America
0.4
/100
|
#262
Tragic
92.6%
Apache
0.4
/100
|
#263
Tragic
92.6%